
Although this analysis is limited to Britain, it is probably relevant for all nations. Following the Great Financial Crisis, capitalism simply reconstructed the same pre-crisis economic system. There was no intention to change anything – nor any need. The lesson was clear. Should something go wrong the state would pick up the tab again.
By Konstantin Bikas, Economist at Positive Money
Cross-posted from Positive Money
Under the current monetary system, bank lending is the main way in which new money is created. Banks’ lending decisions determine which sectors money is directed to which in turn has vast implications for the shape and stability of our economy.
A decade after the last crisis, caused by excessive lending to property and financial markets, it is interesting to see that the problems of the past still haunt us to this day. Most lending is still directed to property and financial markets, with lending to the productive sector lagging significantly behind.
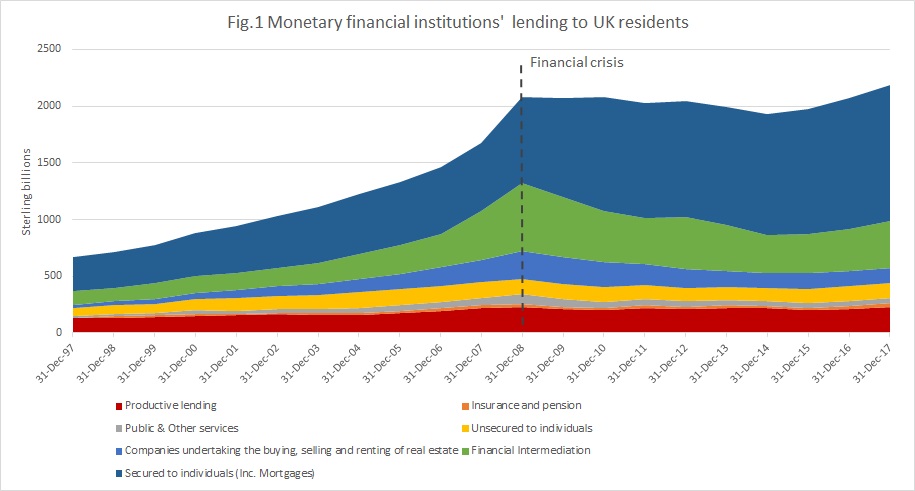
The chart below shows the total sterling amounts of outstanding lending by monetary financial institutions to UK residents. Since 2008 overall lending to the economy has increased by 5% from £2.07tn to £2.2 tn. The largest growth in proportional terms has been in secured loans to individuals (predominantly mortgages), which have increased by 58.7% form £755.5 bn to £1.2tn (seen in dark blue below), and to insurance companies and pension funds, which increased by almost 30% to £33.2 billion (in orange).
On the other hand, the largest decreases since the crisis are seen in lending to public and other services (which decreased by 42% to £47bn – grey bar), to companies undertaking the buying, selling and renting of real estate (which fell by 44.4% to £134.5bn – blue bar) and to the financial sector, which has seen a decrease of 32% from £601.3bn to £408bn (green bar). Productive lending – i.e. loans to sectors which contribute to GDP (Gross Domestic Product) – has stayed pretty much the same (red bar below) and decreased by just under 3% to £226.5bn.
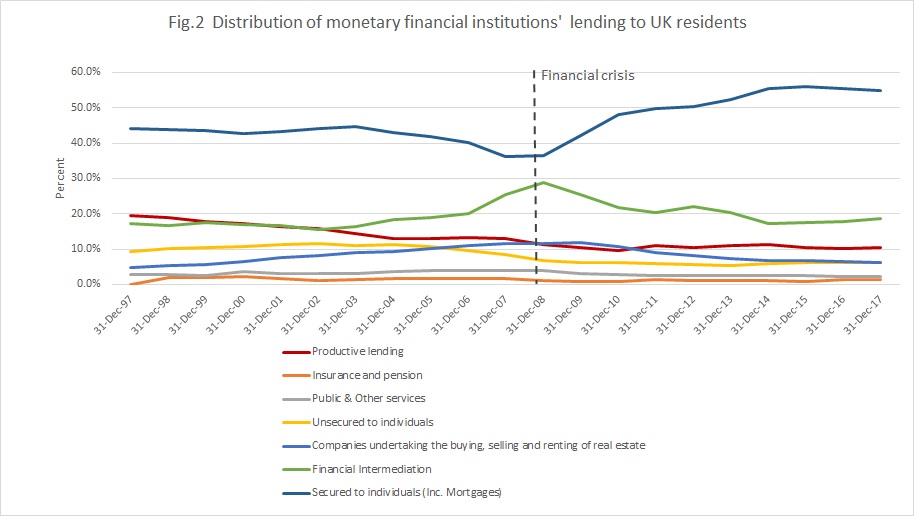
Nevertheless, productive lending, which constitutes the most economically beneficial type of lending, accounts for only 10.4% of total loans (red line below) – a decrease of around 1 percentage point since 2008, as seen in the chart below depicting the relative magnitudes of lending going to each sector. The drawn-out struggle to raise productivity in the UK is reflected in these figures.
Source: Table C1.2 Bank of England statistics
By far the greatest proportion (55%, the dark blue line above) is lending secured to individuals, which is predominantly directed to the property market in the form of mortgages, and has helped sustain an increase in house prices (seen below). Following the financial crisis, house prices took some time to recover but soon resumed an upward trend, interrupted only by recent uncertainty following the Brexit referendum.
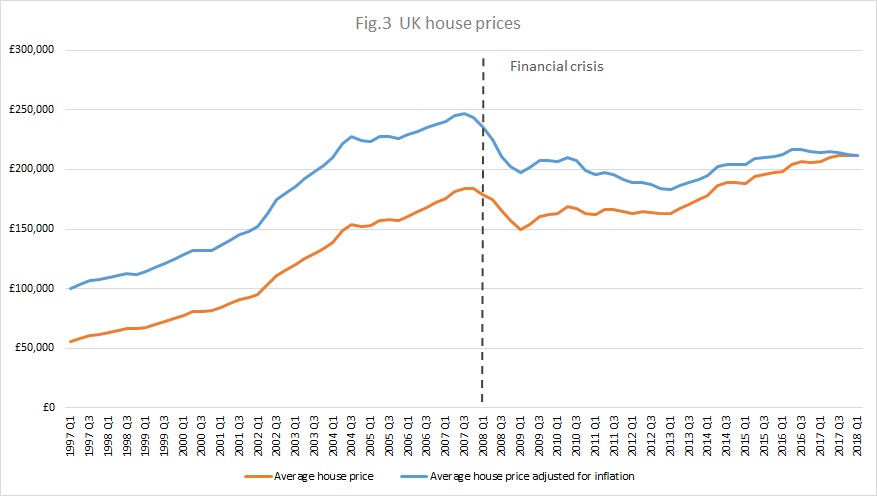 Source: Nationwide
Commentators are watching mortgages closely. Policymakers at the Bank of England have hesitated over raising the base interest rate, but higher costs of borrowing for homeowners will be on the way soon. Regulation since the financial crisis has trimmed back some of the worst excesses of the housing market. The percentage of new loans with a loan-to-value ratio (i.e. the proportion of the home’s value represented by the mortgage loan) over 90% has fallen. However, the percentage of mortgages with a value several times the individual’s income (whether single or joint income – seen below) has been creeping upwards. The Bank of England has warned that mortgage lenders are taking increasing risks.
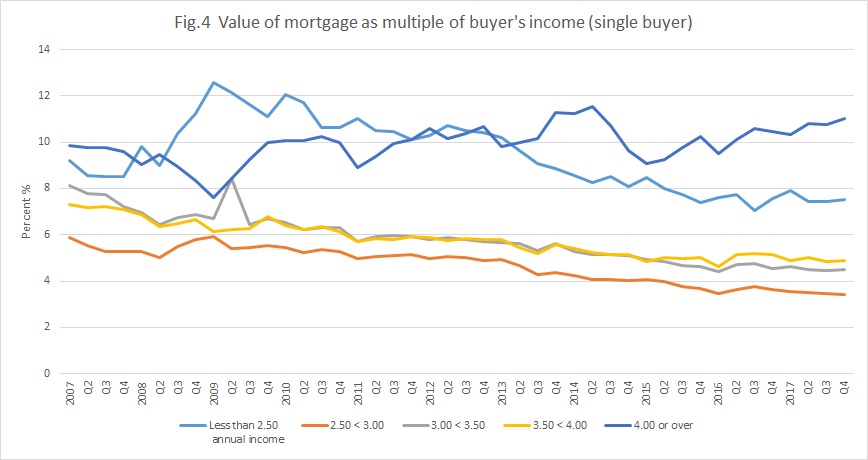
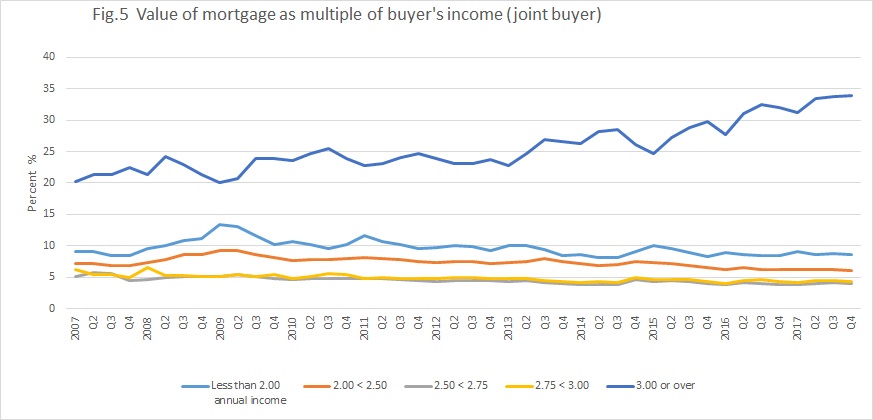
Source: Bank of England, Mortgage Lenders and Administrators’ Statistics Q4 2017
It is encouraging that lending directed to the financial sector has not only decreased in absolute terms but also in relative terms, as it now accounts for 18.7% of all lending versus 29% in 2008 (green line in figure 2 above). Unsecured lending to individuals accounts for 6.1% of total lending (yellow line figure 2), and lending to companies buying, selling and renting real estate for 6.2% (orange line figure 2), both showing a decrease (of 0.6 and 5.5 percentage points respectively).
Overall, it seems that since the financial crisis nothing has significantly changed. The decline in lending to the financial sector is definitely a positive sign. However, the proportion of lending going to the productive sector of our economy remains small. This indicates lower levels of real investment, a fact that has important implications for productivity. In addition, the significant increase in mortgage lending is a sign of danger, especially with interest rate rises on the horizon that will increase the burden of debt repayments for a number of households.

Be the first to comment