
This may be about the public debt in the UK, but is still another example of how public debt is misunderstood and misrepresented.
John Weeks is PEF Council Coordinator, Professor Emeritus, School of Oriental & African Studies, University of London, and author of ‘Economics of the 1%: How mainstream economics serves the rich, obscures reality and distorts policy’, Anthem Press.
Cross-posted from Progressive Economy Forum

The Office of National Statistics recently released the public debt numbers for the second quarter of this year. As I show in my forthcoming book, Debt Delusion, the media and politicians misrepresent few public policy issues as frequently as they do the public debt. The misrepresentations begin with the basics, failure to treat the debt as an asset as well as a liability. Far from a burden, the UK public debt is one of the safest ways for business and households to hold idle cash, playing an essential role in our economy.
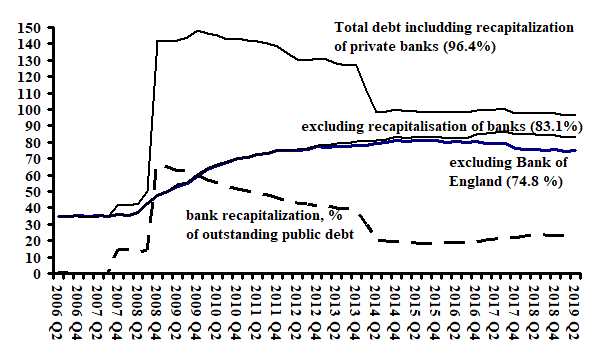
Along with a failure to point out the policy role of the public debt has gone a tendency to misrepresent or misinterpret its size and how it was acquired. This tendency reflects treating the public debt as if it were an undifferentiated burden weighing on the eponymous taxpayer. In reality the public debt after 2007 consists of three quite different components, as the chart shows.
In mid-2019 the total debt of the UK government was 85% of GDP, (public sector net debt excluding public banks such as RBS) or 96% if public banks are included.
While numerically correct, this statistic is quite misleading. The public debt increases when the government incurs a budget deficit. Therefore, the vast majority of the public would infer that the government had over time spent an amount almost equal to its present GDP not covered by revenue, but this is not correct. As strange as it may seem, the government budget can show a deficit without spending. An example is the practice in some countries (but not the UK) of including one-off payments into public servants’ pension funds as expenditure, which do not become actual spending until paid directly to the pension recipient.
The UK public debt provides an example of debt accumulation that did not involve spending. In 2008 the Labour government faced the danger of the imminent collapse of several private banks. To prevent collapse of part or all of the private financial system, in the last quarter of 2008 the government replenished the reserves of threatened banks, replacing with public bonds non-performing loans and other assets that had lost their market value. In that quarter the public debt increased by over £1400 billion, from £777 to £2200 billion, 95% of which was directed to saving (“bailing out”) private banks (see chart).
Thus, 95% of the superficially massive increase in public debt in one quarter, from 50 to 142% of GDP, resulted from action to prevent bank collapse. None of this £1353 billion (92% of GDP) was spending.
The rise is explained by the effects of the Special Liquidity Scheme which allowed illiquid assets of banks to be temporarily replaced with public bonds and the fact that when private sector banks were nationalised, the liabilities of these banks were classified as the public sector.
Further, the replacement represented loans from the government to private banks which the latter were and are required to repay, or government purchase of equity in those banks.
UK Net Public Debt by Quarter, 2006Q2-2019Q2 (percentage of GDP)
The debt created by the bail out of banks simultaneously created assets of equal amount, thus was a sell-cancelling transaction. By mid-2019 much of this self-cancelling debt had been eliminated through repayments to the Bank of England or sale of bank equity.
As shown in the chart the debt that resulted from public expenditure exceeding revenue, what might be named the “expenditure debt”, was only 64% of GDP at the end of the Labour government in the second quarter of 2010. Under the subsequent ten years of Conservative governments the expenditure debt rose by £765 billion to 83% of GDP. Almost every government as well as the International Monetary Fund use this as the official public debt statistic (the “net debt”).
Finally, the net debt of 83% of GDP in 2019Q2 substantially overstates the outstanding debt of the UK government; i.e. the debt it owes to others. The Bank of England holds close to ten percentage points of the net debt, which brings outstanding debt down to 75% of GDP, far below the frequently cited statistic of 96%.
These statistics carry important policy implications:
- The vast majority of the debt accumulation during the last Labour government involved bank rescue, which did not increase the official (net) debt of the government.
- At the end of the Labour government the outstanding debt was 66% of GDP, which was a relatively modest level given the massive shock of the Global Financial Crisis of 2008.
- At no point did the outstanding debt reach dangerous levels by historical comparison.
- The outstanding debt consistently remained low enough to justify borrowing to stimulate a more rapid recovery of the UK economy.
- Debt accumulation provided and provides no justification for deficit reduction and fiscal austerity.

Be the first to comment