
Two old friends meet again
Steve Keen is a Distinguished Research Fellow, Institute for Strategy, Resilience & Security, UCL
Cross-posted from Steve’s website

In his latest column “Wonking Out: Taking the ‘Flation’ Out of Stagflation“, Paul Krugman postulates that the “Phillips Curve”—the relationship between the level of employment and the rate of inflation, which is a central concept in all macroeconomic models—may not be a straight line, as most models assume it to be, but be steep near full employment and relatively flat at higher levels of unemployment:
Historical evidence suggested that the Phillips curve was quite flat — or to put that in English, the rate of inflation wasn’t all that sensitive to how hot or cold the economy was running. But that’s not how things looked in 2021-22, leading many economists to conclude that the relationship between employment and inflation gets much stronger when the economy is running close to capacity. Schematically, the picture may look like this:
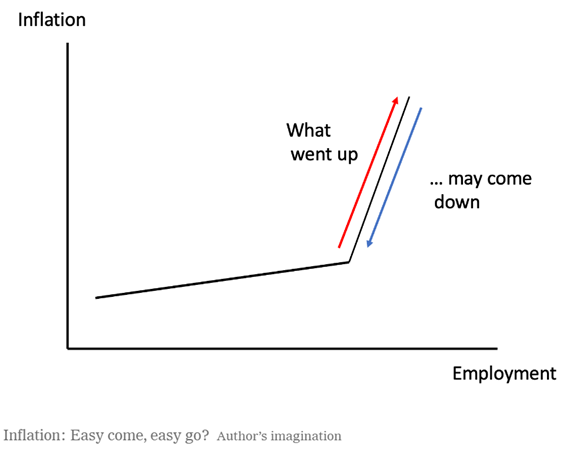
Figure 1: Krugman’s hypothetical nonlinear relationship between the level of employment and the rate of change of prices
With this insight, Krugman has enabled macroeconomics to take a Great Leap Forward—to 1954, when he was still wearing nappies. In that year, Bill Phillips, the “father” of the Phillips Curve, made exactly the same postulate, in a paper entitled “Stabilisation Policy in a Closed Economy” (Phillips 1954):
We may therefore postulate a relationship between the level of production and the rate of change of factor prices, which is probably of the form shown in Fig. 11, the fairly sharp bend in the curve where it passes through zero rate of change of prices being the result of the greater rigidity of factor prices in the downward than in the upward direction. The relationship between the level of production and the rate of change of product prices will be of a similar shape if productivity is constant.
Phillips also used a more sophisticated drawing than Krugman’s, with a curved relationship between the “level of production” and the rate of change of prices, rather than two straight lines with different slopes:
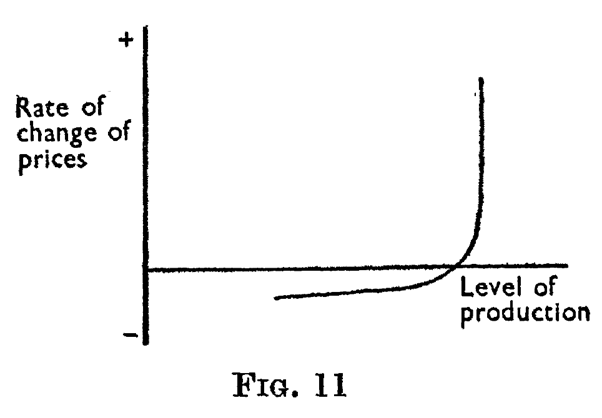
Figure 2: Bill Phillips’s postulated nonlinear relationship between the level of production and the rate of change of prices
Why did Krugman draw his own diagram, rather than using Phillips’s? Because, I’m now certain, he has never read any of Phillips’s papers—not even the one which gave birth to the Phillips Curve, which has played such a pivotal role in the development of macroeconomics ever since.
I removed “almost certain” from the above paragraph, because of Krugman’s opening sentence that “Historical evidence suggested that the Phillips curve was quite flat”. No it didn’t! If it had, there might never have been a “Phillips Curve”, because Phillips’s key conjecture, in 1954, was that this relationship was nonlinear, and that’s what he set out to explore with his empirical paper “The Relation between Unemployment and the Rate of Change of Money Wage Rates in the United Kingdom, 1861-1957” (Phillips 1958). If he had been surprised to find that the data was actually linear, he might well never have bothered writing up his empirical research.
Instead, he found what he expected: a highly nonlinear relationship between unemployment and the rate of change of money wages between 1861 and 1913, which he fitted with a highly nonlinear function—see Figure 3.
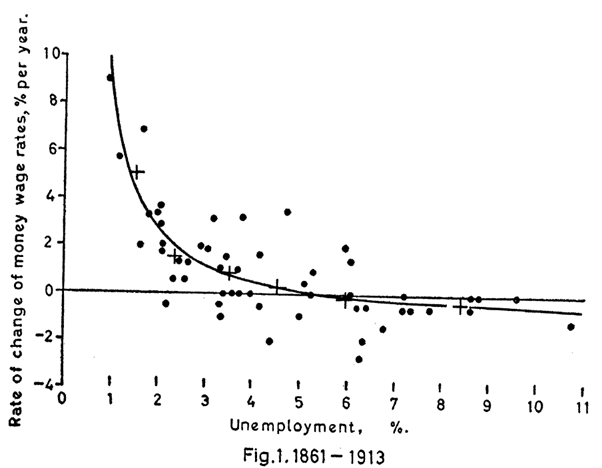
Figure 3: Phillips’s data on unemployment and the rate of change of money wages, and his nonlinear function fitting the data
Phillips’s entire paper was about how nonlinear this relationship was between 1861 and 1913, and how well this nonlinear relationship fitted subsequent data from 1914 until 1957, especially if time lags between the level of unemployment and the rate of change of money wages were taken into account—see Figure 4 (the only significant departure was in 1921 and 1922, when trade unions had negotiated cost of living adjustment agreements, and then the price level plunged when the UK went back onto the Gold Standard).
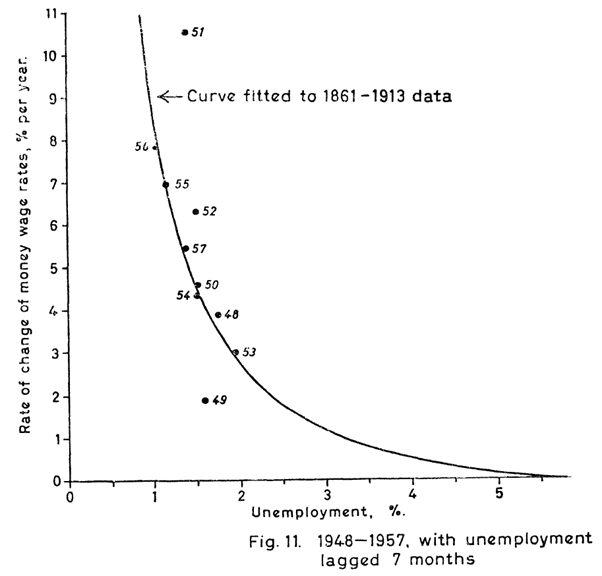
Figure 4: Phillips’s nonlinear curve, fitted to data from 1948-1957, with wage change lagging unemployment by seven months
Krugman’s ignorance of this “historical evidence” is par for the course amongst mainstream, economists: they simply don’t read anything outside the textbooks and papers that their fellow Neoclassical economists write. In fact, Krugman bragged about this disregard for historical evidence in an online fight with me a decade ago, when he said that, when it comes to reading what old economists have written, “I Don’t Care”:
my basic reaction to discussions about What Minsky Really Meant — and, similarly, to discussions about What Keynes Really Meant — is, I Don’t Care. I mean, intellectual history is a fine endeavor. But for working economists the reason to read old books is for insight, not authority; if something Keynes or Minsky said helps crystallize an idea in your mind — and there’s a lot of that in both mens’ writing — that’s really good, but if where you take the idea is very different from what the great man said somewhere else in his book, so what? This is economics, not Talmudic scholarship.
He’s right: this is not Talmudic scholarship, nor scholarship of any kind. Instead, it’s cherry-picking to suit an ideological agenda.
Beginning with Milton Friedman, Neoclassical economists only paid attention to the “Phillips Curve” when the stable relationship it implied between unemployment and the rate of change of money wages started to break down. They ignored not only the essential nonlinearity of the relationship that Phillips described, but also that Phillips specified not just one but three factors that determined the rate of change of money wages: the level of unemployment, “the rate of change of the demand for labour”, and “the rate of change of retail prices, operating through cost-of-living adjustments in wage rates”, a factor which could set off a “wage-price spiral”.
These in turn were the factors that drove wages and prices up during the 1970s, when for a while both the rate of inflation and the rate of unemployment rose, thus—according to Milton Friedman, consigning Phillips’s relationship to the short run, while in the long run there was a “vertical Phillips Curve” where the unemployment rate was determined by the market—the “Natural Rate of Unemployment”—while the government’s attempts to reduce unemployment below this level determined the rate of inflation.
There’s much more to say about what Phillips was actually trying to achieve with his curve, and how this was ignored by mainstream economists, but I’ll stop with a comparison. Imagine that this same shoddy scholarship applied in physics. “Some old guy called Einstein said that E=MC2! But hey, the 2 is probably a footnote number, I haven’t read his paper anyway, and E=MC is simpler—let’s use that.”
Going even further back, we would never have experienced The Enlightenment, if the standards that economists live by today hadn’t been overthrown by Galileo and Newton. Back then, all “scientists” did before Galileo was read “the great books”. That’s what mainstream economists are doing today, as they ignore historical evidence and go by what they have made up in their own textbooks.
Phillips, A. W. 1954. ‘Stabilisation Policy in a Closed Economy’, The Economic Journal, 64: 290-323.
———. 1958. ‘The Relation between Unemployment and the Rate of Change of Money Wage Rates in the United Kingdom, 1861-1957’, Economica, 25: 283-99.
Support us and become part of a media that takes responsibility for society
BRAVE NEW EUROPE is a not-for-profit educational platform for economics, politics, and climate change that brings authors at the cutting edge of progressive thought together with activists and others with articles like this. If you would like to support our work and want to see more writing free of state or corporate media bias and free of charge. To maintain the impetus and impartiality we need fresh funds every month. Three hundred donors, giving £5 or 5 euros a month would bring us close to £1,500 monthly, which is enough to keep us ticking over.

Be the first to comment