

Britain’s prime minister Theresa May had promised to end the “burning injustice of inequality”. Little has changed for the poor, women, and minorities.
By The Women’s Budget Group, Coventry Women’s Voices, Runnymede Trust, and RECLAIM
Cross-posted from Women’s Budget Group
Intersecting Inequalities: the impact of austerity on BME women in the UK
This is a summary of a cumulative impact assessment of the changes to taxes, benefits and public spending since 2010 on Black and Minority Ethnic (BME) women. The report is part of an ongoing project by the Women’s Budget Group and the Runnymede Trust to analyse the impact of government Budgets and spending reviews by gender, race and income. It was researched and written in partnership with Coventry Women’s Voices and RECLAIM.
5.1 million children will be living in poverty by 2021/22.
Benefits and tax credit cuts will cost the poorest £37bn a year by 2020: tax cuts will benefit the better off by £41bn.
Black and Asian women in the poorest third of households will lose over £2,000 a year on average from tax and benefit changes.
The living standards of lone mothers will fall by 18% on average (£8,790) from tax and benefit changes and lost services.
Black families in the poorest fifth of households will see their living standards fall by over £8,400 a year on average from cuts to benefits and services.
Asian families in the poorest fifth of households will see their living standards fall by over £11,600 on average.
Recommendations: A future that works for BME women
End the benefit freeze. Benefits and tax credits should be increased annually, linked to the cost of living and/or average wages.
Review Universal Credit and end the six week wait for payments. Partners should be entitled to split payments. Incentives for second earners and the work allowance need to be improved.
Remove arbitrary caps on benefits. Benefits must be based on household need.
Invest in social infrastructure (health, education and care services). These services are vital to both the economy and the wellbeing and life chances of individuals.
Carry out and publish equality impact assessments of all spending and revenue raising policies.
Assess the cumulative impact of the budget as a whole and monitor the actual equality impact of policies.
Account for the combined impact of different cuts on particularly vulnerable groups in assessments and monitoring.
Base local government funding on need. Ensure the funding system serves the needs of the local population.
The case for change
“I can see my parents, sometimes, I can see my parents really stressed out about money…. it wasn’t like this five years ago. Everything was calm back then. Then all of a sudden, everyone’s stressed about everything.[…]And even at school, I felt uncertain about what was going to happen in the future.” Interview, Manchester
In the 2010 Emergency Budget, George Osborne, the then Chancellor, announced a programme of public spending cuts totalling £83bn[1]. The seven years since the 2010 Emergency Budget have been characterised by further cuts to social security and public services.
Women have been disproportionately affected by these cuts as a result of structural inequalities which means they earn less, own less and have more responsibility for unpaid care and domestic work.[2] BME households also face persistent structural inequalities in education, employment, health and housing meaning that they have also been disproportionately affected by these cuts.[3]
For BME women, gender inequalities intersect with and compound racial inequalities making these women particularly vulnerable to cuts to benefits, tax credits and public services. This report shows the extent to which the BME women, and the poorest BME women in particular, are disproportionately affected by the spending cuts since 2010.
Situation of BME women in the UK
- BME women are more likely to be living in poor households. In 2015/16, 50% of Bangladeshi households, 46% of Pakistani households and 40% of Black African/Caribbean households were living in poverty compared to 19% of White British households.[4]
- BME women face multiple disadvantages, including sexism and racism in the labour market. They face discrimination and bias at every stage of the recruitment process – during the evaluation of CVs and application forms, at the interview stage and once in post.[5]
- Even when qualifications are taken into account, ethnic minority women are more likely to be unemployed than their White counterparts.[6]
- BME women are more likely to live in households with dependent children. Over half of Bangladeshi, Pakistani or Black African households had one or more dependent children compared with just over a quarter of White British households.
- BME women are more likely to live in large families. 51% of Black African, 65% of Pakistani and 64% of Bangladeshi children live in large families, compared to 30% of those in White British families.[7]
Social Security and Tax
Cuts to spending on social security will total £37bn a year by 2020.[8]
- There has been a freeze to working age benefits, while the cost of everyday goods is increasing.
- Benefits and tax credits for children have been capped for the first two children.
- Local housing allowance is no longer linked to actual rents and the bedroom tax reduces housing benefit for families judged to have a “spare” room.
- Cuts to work allowances for Universal Credit and an increased taper rate for second earners (mainly women) reduce work incentives and increase vulnerability to poverty.
- Personal Independence Payments and Employment Support Allowance have replaced previous benefits for disabled people and the overall level of support has been cut.
- Benefit sanctions have increased leaving claimants without money for weeks or sometimes months.
- The overall benefit cap has particularly affected large families.
- As a result of freezes and cuts to working age benefits it is estimated that 5.1 million children will be living in poverty by 2021/22.[9]
BME women are more likely to be affected by cut to benefits and tax credits because they are more likely to be living in poverty, more likely to be living with dependent children and more likely to be living in large families.
“Well at one point I had four jobs, when I was in college, just so I could pay for things.” (Interview, Manchester)
Tax cuts since 2010 will cost £41bn a year by 2020.[10]
- Increases to the personal tax allowance and higher rate tax allowance will cost £19bn a year by 2020.
- Cuts to corporation tax will cost £13bn by 2020.
- Cuts to fuel duty will cost £9bn a year by 2020.
Men will disproportionately benefit from these tax cuts as they earn more, are more likely to be business owners and shareholders and more likely to drive and drive longer distances.
As a result of benefit cuts and tax changes:
- Asian women in the poorest third of households lose on average 19% of their income by 2020 (over £2200) compared to if the policies in place in May 2010 had continued to 2020.[11]
- Black women in the poorest households will lose on average 14% of their income (over £2000 a year).
- Black and Asian lone mothers, respectively, stand to lose £4,000 and £4,200 a year on average by 2020 from the changes since 2010, about 15 and 17% of their net income.
“I just feel because of the cuts, because they are being so strict with benefits and working tax credits and things like that […] it is really difficult if you are a single parent” (Interview, Manchester)
Public Services
There have been a series of cuts to funding for public services. Central government funding for local government, which is responsible for a range of local services, fell by over 50% between 2010/11 and 2015/16[12] and then by a further 30.6% in 2017/18.[13]
Between 2010/11 and 2014/15, excluding spending on schools, the most deprived areas saw the largest cuts, averaging around £222 per head. The most affluent local authorities saw the lowest cut (around £40 per head).[14]
Other cuts include:
- From 2015/16 Schools spending was frozen in cash terms, meaning a real terms cut of around 6.5% from 2015/16 to 2019/20.[15]
- The NHS was required to make £20bn of ‘efficiency savings’ between 2011 and 2015.[16]
- There were severe cuts to Legal Aid coverage for debt, education, employment, housing, immigration, welfare benefits and family law cases.
- Spending on social care for older and disabled people has fallen by 11% in real terms and the number of people receiving state funded help has fallen by at least 25%.[17]
- By 2015 local authority funding for Sure Start had been cut by a third, with 84% of local authorities reporting cuts to funding for Children’s Centres[18].
- Since 2010, 17% of specialist refuges in England have closed. A third of all referrals to refuges are turned away (155 women and 103 children a day), normally due to lack of available space.[19]
These cuts have disproportionately affected women, who are more likely to need public services, and more likely to be caring for children and other family members who need services. Women are also more likely to have to make up to cuts to services through unpaid work. These cuts have also disproportionately affected the poorest families, including BME families, who are more likely to be poor.
“There have been cuts in interpreters at hospitals. At one hospital the doctor asked a ten-year-old girl to interpret for her mother. It isn’t appropriate. If they have been a victim of abuse they will not disclose it if their child is interpreting.” (Interview, service provider, Coventry)
- The poorest 10% of households will lose on average services worth over £4,300 a year by 2020, presenting nearly 12% of their living standards.[20]
- Black and Asian families will lose more in public services than White families, with their average living standards cut by 7.5%, 6.8% and 5% respectively.
- Female lone parents, who make up 92% of all lone parents, will lose on average services worth over £4,900 (over 10% of their standard of living). Black women are overrepresented among single parent households.
- Among the poorest 20% of households, Black and Asian households see their living standard cut by 11.6% and 11.2%, while the living standard of White households will fall by 8.9%. In cash terms for these households, this represents a cut of £5,090 for Black households, £6,526 for Asian households, and £3,316 for White households.[21]
Putting it all together
The very same groups that are hardest hit by the tax and benefit changes are also those that are the most affected by cuts to public services.
- The poorest families lose the most; with an average drop in living standards of around 17% by 2020.
- Black and Asian households in the lowest fifth of incomes experience the biggest average drop in living standard of 19.2% and 20.1%, respectively. This equates to a real-terms annual average loss in living standard of £8,407 and £11,678.
- Lone mothers (who represent 92% of lone parents) will experience a drop in living standards of 18% (£8,790).
Cumulative real-term impact of tax and benefit changes and public service spending cuts on living standards in % terms between 2010 and 2020 by income and ethnicity
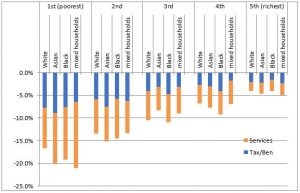
Source: Women’s Budget Group 2017
Conclusion
Theresa May became Prime Minister promising ‘a country that works for everyone’. She committed to fight the ‘burning injustice of inequality’, to support those who are ‘just managing’ but find life hard and to prioritise ‘ordinary working class families’ over the wealthy few.
This is not happening. Our research clearly shows that the injustice of inequality is being exacerbated by cuts to benefits and services that have hit the poorest hardest. Women are losing more than men and BME households are losing more than White households. The intersection of poverty, race and gender means that these cuts will lead to a dramatic fall in the standard of living of many BME women.
About us
The Women’s Budget Group is network of leading feminist economists, researchers, policy experts and campaigners committed to achieving a more gender equal future. www.wbg.org.uk
Runnymede Trust is the UK’s leading independent race equality think tank www.runnymedetrust.org
Coventry Women’s Voices works to ensure women’s voices are heard in Coventry when policy is made www.coventrywomensvoices.wordpress.com
RECLAIM is a youth leadership and social change organisation www.RECLAIM.org.uk
We would like to thank the Barrow Cadbury Trust for funding the researching and writing of this report, and for their support with our on going intersectional analysis of UK budgets. www.barrowcadbury.org.uk
[1] BBC report on Government Spending Review 18 October 2010. Available online at http://www.bbc.co.uk/news/business-10810962
[2] See WBG budget analysis available online: http://wbg.org.uk/analysis/assessments/
[3] Reed H and Portes J, (2014), Cumulative Impact Assessment: A Research Report by Landman Economics and the National Institute of Economic and Social Research (NIESR) for the Equality and Human Rights Commission, EHRC. Available on line at: https://www.equalityhumanrights.com/sites/default/files/research-report-94-cumulative-impact-assessment.pdf
[4] Poverty is measured as the proportion of people living in households with an after housing costs income below 60% of the contemporary median household income.
JRF (2017). Poverty rate by ethnicity available at: https://www.jrf.org.uk/data/poverty-rate-ethnicity.
[5] Runnymede Trust (2013) All Party Parliamentary Group on Race and Community
McGregor-Smith (2017) Race in the Workplace. Available at: https://www.gov.uk/government/uploads/system/uploads/attachment_data/file/594336/race-in-workplace-mcgregor-smith-review.pdf
Ashe, S; Nazroo, J (2016) Equality, Diversity and Racism in the Workplace: A Qualitative Analysis of the 2015 Race at Work Survey. Available at: https://race.bitc.org.uk/system/files/research/race_at_work_equality_diversity_and_racism_in_the_workplace_executive_summary_november_2016.pdf
[6] NAO (2008) Widening participation in higher education. Available at: https://www.nao.org.uk/wp-content/uploads/2008/06/0708725.pdf
Catney, G; Sabater, A (2015) Ethnic minority disadvantage in the labour market. Available at: https://www.jrf.org.uk/report/ethnic-minority-disadvantage-labour-market
Alexander, C, Weekes-Bernard, D and Arday, J (2015) The Runnymede School Report Race, Education and Inequality in Contemporary Britain. Available at: http://www.runnymedetrust.org/uploads/The%20School%20Report.pdf
[7]WBG calculations by Lucinda Platt (LSE), based on Households Below Average Income surveys (2010/11 to 2012/13). ‘Large families’ here means 3 or more children.
[8] WBG (2010) Gender impact of social security spending cuts. Available on line at: https://wbg.org.uk/wp-content/uploads/2017/03/WBG_briefing_Soc-Security_pre_Budget.pdf
[9] IFS (2017) Living Standards, Poverty and Inequality in the UK: 2016-17 to 2021-2022. Available at: https://www.ifs.org.uk/publications/8957
[10] WBG(2017) Gender impact of taxation. Available on line at: https://wbg.org.uk/wp-content/uploads/2017/03/WBG_briefing_Taxation_pre_Budget-2017_03_07.pdf
[11] compared to what they would be receiving if 2010 rules still in place
[12] IFS, Council-level figures on spending cuts and business rates income, November 2016, https://www.ifs.org.uk/publications/8780
[13] Local Government Association: LGA responds to the Local Government Finance Settlement, December 2016 https://www.local.gov.uk/about/news/lga-responds-local-government-finance-settlement-0
[14] Joseph Rowntree Foundation, The cost of the cuts: the impact on local government and poorer communities, 2015, https://www.jrf.org.uk/report/cost-cuts-impact-local-government-and-poorer-communities
[15] Institute for Fiscal Studies (2017) Long-run comparisons of spending per pupil across different stages of education. Available at: https://www.ifs.org.uk/uploads/publications/comms/R126.pdf
[16] Department of Health (2013) Making the NHS more efficient and less bureaucratic. Available at: https://www.gov.uk/government/publications/2010-to-2015-government-policy-nhs-efficiency/2010-to-2015-government-policy-nhs-efficiency
[17] Humphries et al, Social care for older people: home truths, Kings fund and Nuffield Trust, 2016, https://www.kingsfund.org.uk/sites/files/kf/field/field_publication_file/Social_care_older_people_Kings_Fund_Sep_2016.pdf
[18] Public Sector Executive, Council funding for children’s centres cut by a third under coalition, April 2015, http://www.publicsectorexecutive.com/Public-sector-focus/council-funding-for-childrens-centres-cut-by-a-third-under-coalition
[19] Women’s Aid England and Wales, Save Refuges, Save Lives, 2016 https://www.womensaid.org.uk/what-we-do/campaigning-and-influencing/campaign-with-us/sos/
[20] ‘Household living standards’ are defined in this model as the value of household disposable income plus the use-value of public services as measured by the cost of delivery of those public services.
[21] Unlike the analysis of tax and benefits in the previous chapter which is carried out at the individual and household level, the analysis of public service spending is done solely at household level.. As such, graphs here are only disaggregated further by gender insofar as there are gendered household types (e.g. lone female parents, single male pensioner etc.)

Be the first to comment