
Today the British Treasury announced a massive surplus for January. As we know, there is no such thing as a free lunch, so who is paying the bill. Here the answer: ‘Fixing’ the public sector finances has suppressed the economy by almost £100bn, around £1,500 for every woman, man and child this year alone.
Alfie Stirling is head macroeconomics at the New Economics Foundation, including monetary policy, fiscal policy and social security.
Cross-posted from New Economics Foundation

Today’s public sector finance release shows we’re on course for the smallest government deficit – difference between public spending and revenue – since 2001. What they don’t show is the economic damage it has caused to get here.
January is a bumper month. Midnight on the 31st is the deadline for self-employed tax returns, meaning that a backlog of receipts always flow into government coffers at this time of year. It’s for this reason that there has been a January surplus ever since 2010, and this year receipts exceeded expenditure by an estimated £14.9 billion in the month.
Most years, in the second half of most Februaries, the associated media coverage spends numerous column inches speculating over whether the January surplus was large enough for the Chancellor to meet his year-end deficit targets by March.
But for nine years, the elephant in the room has largely been missed: the sheer scale of economic damage that these targets have contributed to in the first place.
Part of the reason for this is that it is extremely hard to estimate what the economic impacts of austerity have been, and near impossible to do so using data and methodologies accepted by government themselves.
The starved ambition and resources of our public realm have touched the lives of almost everyone.
The human impacts have always been clear. Whether rising homelessness, frozen benefit payments, overcrowded school classes or excessively long waits in hospital A&E services, the starved ambition and resources of our public realm have touched the lives of almost everyone.
But the obsession by economists with GDP has often muddied the water. Undue focus on metrics as narrow as GDP often get in the way of a more textured and accurate assessment of whether an economy is serving its society. Nonetheless, a lack of clarity over the observable effects of austerity on GDP have probably limited the interest of much of the mainstream commentariat.
So what have been the impacts, if any, on the country’s overall level of income? Now, thanks to a relatively recent innovation from the Office for Budget Responsibility (OBR), it is possible to get closer to the answer than ever before. Better still, the analysis comes from the government’s own independent watchdog themselves.
Since 2017, assisted by work at the Institute for Fiscal Studies (IFS), the OBR have published the isolated effects of so called ‘discretionary fiscal policy’ – active government decisions over tax and spending – on GDP growth. This work differs from past estimates, where the direct effect of government decisions were previously not disentangled from assumptions over other economy-wide effects.
The most recent OBR modelling was published in December last year. Building on the work already done by others, new NEF analysis has built on these numbers to estimate the effects of austerity on GDP over the decade so far.
The calculations make for grim reading. The isolated impact of government policy has reduced GDP growth every single year since 2010. After compounding this effect year-on-year, the effects of austerity are expected to have suppressed the level of GDP by almost £100 billion in the 2018/19 alone.
Nine years of government austerity has had the effect of suppressing GDP by £100bn in 2018/19
Isolated impact of discretionary fiscal policy on real GDP (2009/10=100), 2010/11 to 2018/19
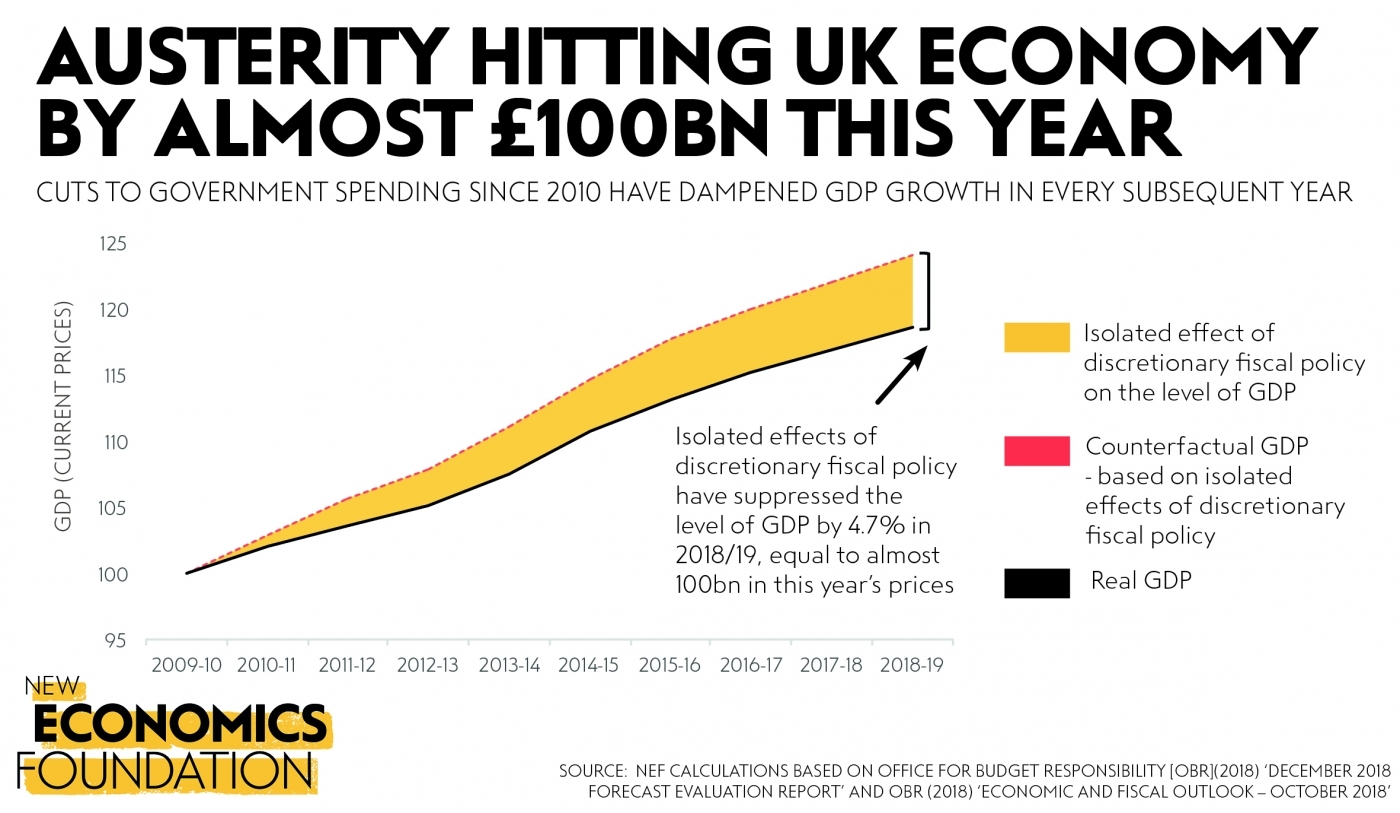
Source: NEF calculations based on Office for Budget Responsibility [OBR] (2018) ‘December 2018 Forecast evaluation report – charts and tables’ and OBR (2018) ‘Economic and fiscal outlook – October 2018’
To break this number down another way, it means that deliberate policy from government over the past nine years has had the standalone effect of suppressing incomes and expenditure in the economy by just under £1,500 per person and more than £3,600 per household, in this year alone. We also know the effects have not been evenly felt, with the heaviest burden borne by the poorest households in society.
To put this in a Brexit context, the Bank of England’s recent estimate that uncertainty since the 2016 referendum will cost the economy 2% of GDP in 2018/19, works out at about £600 per person or £1,500 per household in 2018/19. Although it should be noted that Brexit has only affected GDP growth for two years so far, whereas austerity has impacted the economy for nine years – unfortunately there is still the potential for things to deteriorate further after 29 March.
Government will point to standard assumptions in economic models that the effects of fiscal policy erode over time. But by far the single most important reason for this is that monetary policy is supposed to offset unwanted fiscal impacts by changing interest rates. For example, if the isolated effects of fiscal policy are to suppress GDP, the Bank of England would be expected to cut interest rates to increase private investment.
Many economist agree that monetary policy has been unable to offset most, let alone all, of the damage from austerity.
But in actual fact, it is unlikely that this has happened to any great extent. As early as 2009, interest rate cuts reached a point beyond which further reductions had little or no positive effect on spending in the economy – what economists now refer to as the ‘effective lower bound’. Since then, the positive effects of so called ‘quantitative easing’ have been uncertain at best.
Many economist agree that monetary policy has been unable to offset most, let alone all, of the damage from austerity.
The existing evidence is also consistent with this view. For example, it is striking that the economy almost returned to recession soon after austerity was installed, and that progress on recovering the so called ‘output gap’ – the difference between what the economy is actually producing and its hypothetical potential given available technology and people’s willingness to work – also stalled from 2010 onwards.
Worst of all, the sad truth is that austerity needn’t have happened at all.
There was in fact ample time and space to reduce borrowing more slowly as a proportion of GDP across the period. By not doing this, government in fact offloaded part of the country’s debt burden onto those that could least afford it – with households increasingly having to borrow to maintain consumption in the economy.
A more sophisticated fiscal policy framework, such as that underdevelopment at NEF, would certainly have helped the Treasury to avoid otherwise unnecessary economic harm. Avoiding these mistakes next time should now be a priority for any future government.
It may be that the Chancellor meets his deficit reduction targets this year. We will have to wait and see. But ironically, the damage caused in doing so – in terms of weaker GDP and therefore government tax receipts over the past nine years – is also the reason that the majority of targets have also been missed since 2010.
Either way, the bigger picture is that the livelihoods of people and communities have been made bleaker as a direct consequence of the actions from their own government. Next time must be different.
Table of NEF calculations
Isolated impact of discretionary fiscal policy on real GDP, 2010/11 to 2018/19
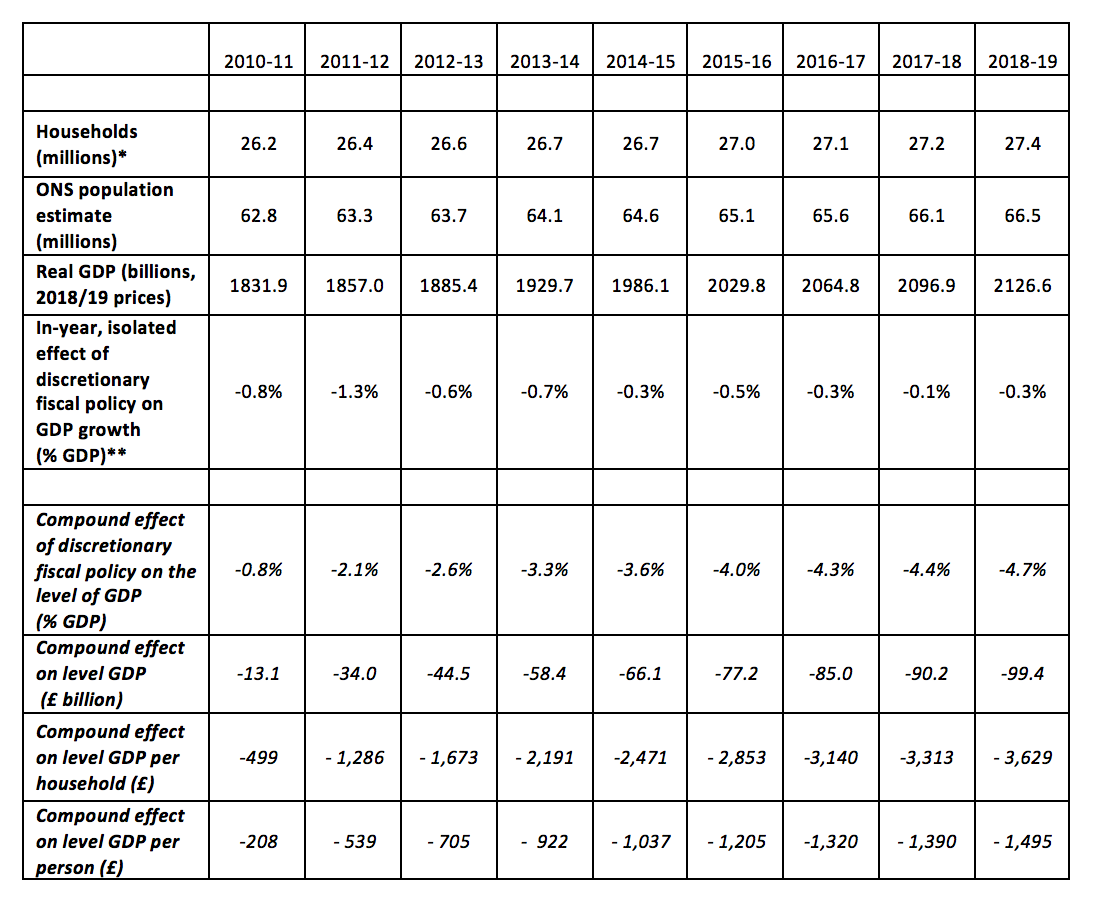
Source: NEF calculations based on OBR (2018) ’December 2018 Forecast evaluation report – charts and tables’, OBR (2018) ‘Economic and fiscal outlook – October 2018’, ONS (2017) ‘Families and households’ and ONS (2018) ’Overview of the UK population: November 2018’
* The forecast for number of households has been estimated by assuming that the ratio of households to individuals in the population remains constant
** This is the isolated effect of discretionary fiscal policy – active changes in the level of tax and spending – before taking into account any subsequent unwinding of these effects. Normally, the effects of fiscal policy would be expected to unwind over time, largely due to any necessary offsetting action taken from the Bank of England’s Monetary Policy Committee (MPC). However, there is a broad consensus among economists that the ability of the MPC to respond to negative shocks has diminished due to interest rates reaching their effective lower bound since 2009

Be the first to comment