
Central banks have manoeuvred themselves into a situation where without a major paradigm change they will not be able to initiate major interest rate increases.
Carey W. King is a Research Scientist and the Assistant Director of the Energy Institute at The University of Texas at Austin. He is the author of the book The Economic Superorganism: Beyond the Competing Narratives on Energy, Growth, and Policy.

Photo: Rdsmith4 licensed under the Creative Commons Attribution-Share Alike 2.5 Generic
Much current investment and policy discussion focuses on inflation and interest rates. The thought is that inflation has been running too high for too long since the onset of the COVID pandemic. Investors and policymakers want to know when, how fast, and to what degree the U.S. Federal Reserve (and other central banks) will raise it target interest rate to lower inflation. The main reason why the Fed won’t be able to raise interest rates to anywhere near historical rates is because of high debt levels. However, the main reason why we have high debt levels is not among the usual reasons given: energy.
In short, in the long-term, the sequence goes from energy to debt to interest rates.
While energy has been part of the discussion of present inflation, even before Vladimir Putin’s invasion of Ukraine, it has mostly been from a short-term perspective (< 1 year or so) of price increases since onset of the pandemic. The news commonly reports stories of “pain at the pump” whenever gasoline prices reach near 4 $/gallon in the U.S, but practically never do they report on the longer-term context of energy prices and total costs, say as a fraction of GDP.. A relatively new “short-term” pain was that in late 2021 natural gas (NG) prices rose significantly to levels never seen before in Europe, maintaining levels well over 75 Euro/MWh (20 $/MMBtu), usually less than half of that price. This had some upward effect on U.S. NG prices, particularly in the Northeast since due to relatively limited pipeline capacity and because of the linkage to liquified natural gas (LNG) exports from the U.S. As mentioned by Steven Otto of ISO New England during his UT Energy Symposium talk on February 8 this year, some power plants in the Northeast actually burned oil this past winter for power generation because it was cheaper than natural gas (previously unheard of!).
The European NG prices since the onset of the Russian forces moving into Ukraine, and the possible permanent delay of Germany’s certifying the Nord Stream 2 pipeline connection from Russia, are even more unprecedented, reaching 200 Euro/MWh (~65 $/GJ). Time will tell how long this will last, but my guess is that 10s $/GJ for natural gas in Europe will become the norm.
Some have asked whether or not today’s inflation represents a parallel situation to the stagflation of the 1970s and early 1980s when high oil prices (imported into the OECD), heavy U.S. military spending on Vietnam War, and wage contracts linked to inflation drove inflation. There are parallels to this time, but I will focus on the significant long-term differences of the “before 1970s” to the “after 1970s”.
First, before the 1970s the world monetary system was linked to the gold standard, via the U.S. dollar as in the Bretton Woods system. The gold link ended in the early 1970s.
Second, another major difference is the high level of both private and public debt that accumulated after the 1970s. The U.S. Total Debt and Loan to GDP ratio rose from near 160% in the 1970s to over 370% in 2009 at the peak of the Great Recession. After a decline after 2009, this ratio has remained above 350% since, with a short peak over 400% at the beginning of the COVID pandemic. And while federal government debt is part of this figure, it is less than a third of the total and least important (since the sovereign U.S. government can print its own currency) compared to the rest of the total composed of private (mortgage, cars, student loans, private firms) and financial debt.
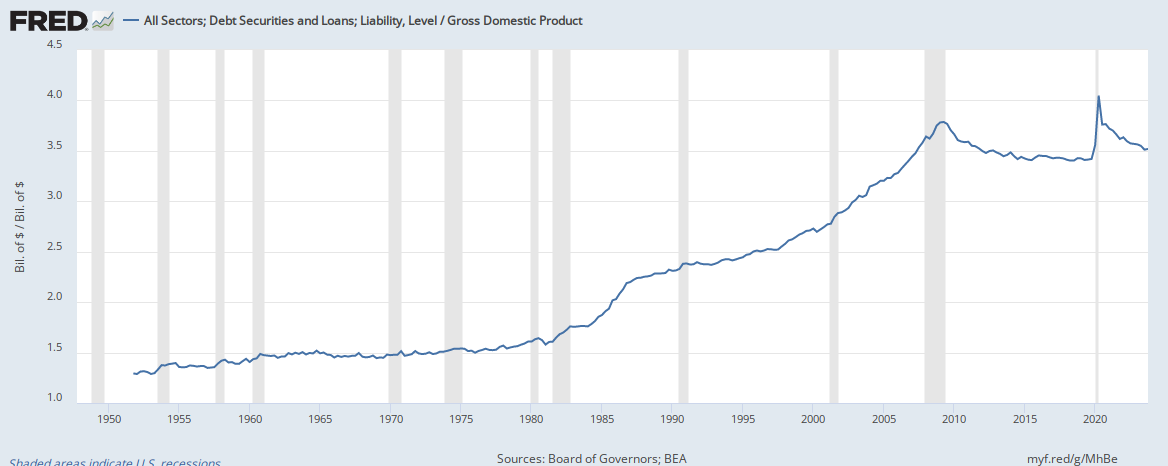
Figure 1. Total U.S. debt and loans divided by GDP.
Third, the U.S. Fed generally raised interest rates from World War II through the 1970s, and decreased them since the 1980s. Fed Chair Paul Volcker sharply raised interest rates, to well over 10 percent starting in the late 1970s, in face of rising inflation and energy prices.

Figure 2. Effective federal funds rate of the U.S. Federal Reserve.
Fourth, it is not debt itself that is unsustainable, it is the interest payments on debt.
As seen in the figure of U.S. debt ratios ((debt + loans):GDP) accelerated in the 2000s, largely driven by mortgage loans. The manipulation to get people into mortgages they couldn’t afford is well-documented, and the “unaffordability” is partially expressed itself as interest payments that were too high for incomes. These levels of interest payments at 4-4.5% of income and over 2% of GDP from the mid-1980s until the 2008 Global Financial Crisis stayed relatively constant. This was possible because even as debt levels rose, interest rates fell. The unsteady but continuous decline in interest rates, part of what is known as the Greenspan Put, enabled companies and consumers to refinance debts since they were confident they could continue to borrow more without having higher interest payments. The interest payments on these private debts proved too much for too long, leading to the 2008 Global Financial Crisis.

Figure 3. Personal (household) interest payments as share of income (as wages and salaries).

Figure 4. Personal (household) interest payments as share of GDP.
One hidden trend behind the debt ratio is the decrease in energy consumption starting in the 1970s. In years from World War II through the 1970s, U.S. (and global) energy consumption grew at historically high rates never experienced before or since, about 4%/year. Since the 1970s energy consumption has increased at only about 2%/year. In effect, the world truly became global during the 1970s Oil Crises and the U.S. peaked in oil production and oil prices became controlled more directly by OPEC and also newly-formed global oil markets.
The U.S. debt and loan ratio reflects the global trend in that, while investment continued to increase at pace, the returns did not. The returns were lower because the rate of increase in energy extraction, and thus consumption, no longer increased as fast as before. Because every single monetary transaction is coupled with some amount of energy consumption, slower increases in energy consumption (and energy efficiency) meant slower increases in GDP. However, while profits (as a share of GDP) remained the same, investment increased with the falling interest rates. From the 1970s to the dot-com bust of 2001, U.S. investment was over 2 times the level of profits, rather than a steady 1.5 times profits from WWII to the 1970s. Profits were only about 8-10% of GDP after the 1970s rather than 10-12% after the 1970s, yet investment was a higher share of GDP after the 1970s (near 18%) than before (near 16%). Hence, a higher debt increase.
To fight the increase in the total debt ratio (from slower increase in real output and higher rate of investment), again, the Federal reserve via the Greenspan Put, continuously reduced interest rates to prevent increasing debt levels from crippling the economy. Once the federal funds interest rate reached zero at the peak of the financial crisis, it has been hard to stay away from rates near 0%. Simple mathematics helps understand why.
Interest payments are equal to the debt level times interest rate. When these interest payments overwhelm budgets, defaults can occur en masse and lead to contractions in spending that trigger a recession. Of course speculative investments and mortgage fraud contributed significantly to the immediate run up to the Global Financial Crisis. Yet to a large extent, the economic ball of debt was already rolling with so much momentum that a debt crisis was likely inevitable. We were going to continue to borrow more than the real economy could return until it didn’t work any more. The only reason it appears to continue to work is by holding interest rates at rock bottom to keep interest payments are as low as possible.
Now, as in the 1970s, the world is in a state of turmoil with high energy prices and expenditures threatening to trigger recession. The main difference is we are now saddled with 2-3 times more debt. While energy consumption is necessary to run the economy, as Michael Hudson states: “debts that can’t be paid, won’t be.” Thus, in the current structure of the U.S. and world economies, central banks are in a Catch-22 situation. in the current structure of the economy (labor-capital relationships, tax rates) central banks will be forced to keep interest rates near zero in an attempt to prevent interest payments from saddling real capital investment and consumption.
To summarize, remember the sequence energy GDP debt interest rates interest payments. Higher energy consumption translates to higher GDP. Lower rates of increase in energy consumption and GDP after the 1970s, combined with increased investment rates, translated to higher debt ratios. Increasing debt ratios pressured the U.S. Federal Reserve and other central banks to decrease interest rates to prevent interest payments from reducing economic growth. Developed economies have been stuck in a state of high debt, low interest payments, and stagnant energy consumption since the 2008 Global Financial Crisis (if not a few years earlier). Without a restructuring of debt (i.e., debt forgiveness) and/or labor-capital relations, central banks will be forced to keep interest rates near zero.
Support us and become part of a medium that takes responsibility for society
BRAVE NEW EUROPE is a not-for-profit educational platform for economics, politics, and climate change that brings authors at the cutting edge of progressive thought together with activists and others with articles like this. If you would like to support our work and want to see more writing free of state or corporate media bias and free of charge. To maintain the impetus and impartiality we need fresh funds every month. Three hundred donors, giving £5 or 5 euros a month would bring us close to £1,500 monthly, which is enough to keep us ticking over.

The ‘effectiveness’ if interest rates?
“Examining the relationship between 3-month and 10-year benchmark rates and nominal GDP growth over half a century in four of the five largest economies we find that interest rates follow GDP growth and are consistently positively correlated with growth. If policy-makers really aimed at setting rates consistent with a recovery, they would need to raise them. We conclude that conventional monetary policy as operated by central banks for the past half-century is fundamentally flawed. Policy-makers had better focus on the quantity variables that cause growth.