
This article is the first of several by John Weeks that will assess whether the European Union has achieved its founders’ stated goals of national and regional prosperity, convergence of development level across countries, and fostering mutually beneficial trade among members. He begins by focussing on fiscal policy and its impact.
John Weeks is Professor Emeritus at SOAS, University of London, and associate of Prime Economics

The national governments of the European Union in February 1992 signed the Maastricht Treaty which first specified the rules on fiscal balances. Twenty years later the Treaty on Coordination, Stability and Governance (TCSG) restated these in stricter form. Two governments declined to sign this treaty, preventing unanimous adoption. As a result, its provisions became part of EU law via the European Parliament, though not through a vote of MEPs. The formal basis for restrictive fiscal policy, “austerity”, has been in place for almost 20 years. The global financial crisis converted those so-called convergence rules from medium term criteria for joining the euro into short term constraints on fiscal policy.
Chart 1 shows the percentage change in government current expenditure in constant euros by country for the second quarter of 2017 compared to the first quarter of 2010. The comparison to early 2010 is appropriate because that marks the beginning of concerted pressure on governments, first the Greek government, to reduce fiscal deficits. The statistics cover all non-euro countries, and those of the euro zone (no data for Cyprus and the Slovak Republic for this chart). By definition current expenditure excludes investment. With few exceptions, current expenditure accounts for 95% or more of public expenditure. Wages and salaries are its largest component.
Over the seven years in 12 euro zone countries inflation adjusted current expenditure increased and five it declined. The four countries with the largest increases include the two smallest members (Luxemburg and Malta), that have less than 1.5% of the euro zone population. At the other end, the five countries with declining expenditure include two of the largest members (Italy and Spain), with 38% of the zone’s residents. By contrast only one of the non-euro countries shows a decline, Croatia.
A useful benchmark for public expenditure is whether it keeps pace with population growth. Failing to do this means that public provision of services declines per capita. In 10 of the 17 euro zone countries public services per capita increased, in six it declined, and in one there was no change. Again, the contrast to non-euro countries is clear. In all nine non-euro countries expenditure rose more than population, though in Croatia this was due to contracting population.
Chart 1: Government Current Expenditure, 17 Eurozone
& 9 non-euro countries, 2017Q2 Compared to 2010Q1
(% change, constant euros 2010)
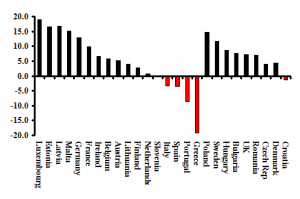
Source: Eurosrat.
Note: No statistics for Cyprus and the Slovak Republic.
Chart 2 emphasizes the difference in public expenditure growth for the two groups over a slightly longer period. In mid-2017 German public current expenditure was over ten percent above its level in early 2010. For the non-euro nine the increase was lower, about 8%. For the other 16 euro countries the increase was a meagre 2%. These statistics demonstrate the greater fiscal austerity in the euro zone, either due to commitment by national governments or greater effectiveness of EC enforcement of fiscal rules on common currency countries, or a combination of both.
In the long term increases in capacity determine the growth of an economy. In the short term demand drives growth because it determines how much of capacity is used. Economies have four sources of demand, consumer expenditure, private domestic investment, export sales and public expenditure. If governments constrain the growth of public expenditure, one of the other sources of demand must replace it. Restraining public spending to reduce fiscal deficits, austerity policy, is by its nature growth-reducing.
Chart 2: Government Current Expenditure for Germany,
16 Eurozone & 9 non-euro countries, Percentages Compared
to 2010Q1 (constant euros of 2010)
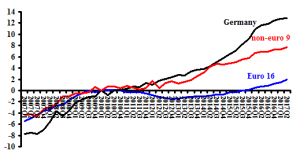
Source: Eurostat.
Notes: No statistics for Cyprus & Slovak Republic. Expenditure is the annual equivalent, sum of current and previous three quarters.
Chart 3, more technical than the first two, verifies that general conclusion. The vertical axis measures for 26 euro and non-euro countries the percentage change in constant gross domestic product from the first quarter of 2010 compared to the second quarter of 2017. The horizontal axis shows the percentage change in inflation-adjusted government expenditure over the same period. The dashed line indicates the statistical relationship between the two variables. A ten percent increase in government spending is associated with an increase in growth by 11 percent (for example, from 2.0 to 2.2 percent).
Chart 3: Percent Change in Public current Expenditure (PCXp, horizontal)
and GDP (vertical) 26 countries, 2010Q1-2017Q2 (constant prices of 2010)
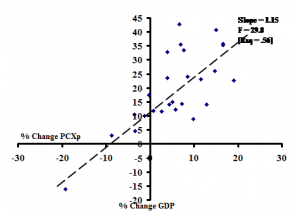
Source: Eurostat.
Notes: Current expenditure excludes capital investments by the public sector. In a two variable regression the F-statistic, t-statistic and R-square are the same measure. Sample size (number of countries) is 26. Government spending is the annual equivalent, measured in each quarter as the sum of the current and previous three quarters.
These statistics support the conclusion that austerity fiscal policies depressed growth in the EU, more so in the euro zone than for countries with national currencies. They did this by reducing the public sector expenditures in the name of “sound fiscal policy”. Far from sound, this policy has undermined public services throughout Europe.
Evidence is strong that the current institutional and regulatory framework of the European Union has not fostered prosperity among its members, either those with their own currencies or those in the euro zone. It makes a distinction without a difference to attribute this failure to the actions of national governments rather than EU officials in Brussels. Throughout the 2010s centre-right to hard-right governments have held power in the vast majority of countries. Led by the German governments of Christian and Social Democrats, right wing regimes have reproduced their reactionary national policies at the regional level. By going so they have undermined prosperity.

Be the first to comment