
The EU has a terrible habit of incorrectly interpreting data to create successes. Karl Brenke has a brilliant habit of exposing this.
Karl Brenke is an Economist at the the German Institute for Economics (Deutsches Institut für Wirtschaft DIW) in Berlin.

What goes up must come down – and vice versa. This is the central finding of economic research, because an economic downturn is always followed by an upswing that has reached its zenith after a certain time and enters another downturn. This is also the case with the more recent economic development in the EU. After a number of good years, the 2008 global financial crisis led to a sharp decline in production. In addition, hidden problems emerged in some euro-zone countries – such as excessive national debt in Greece or a property price bubble in Spain.
In some EU member states the financial crisis was only a brief episode, as an economic recovery set in soon afterwards. In other countries the downturn lasted longer. For example, Germany and the UK reached their economic nadir in 2009, Spain and Portugal in 2013 and Greece only in 2016. Moreover, there were specific developments. Italy, for example, which had recovered only slightly from the financial crisis, slipped back into recession in 2012 and later only recovered slightly. The overall economic situation within the EU has been rather uneven in the decade to date. According to available data up to the summer of 2018, however, economic output is currently growing in every EU country – albeit at different rates.
Now that there is an upswing throughout the union, unemployment is also declining. In the EU as a whole, 2013 was the peak year, when 26.3 million people were unemployed. In some countries the peak was reached earlier, in others later: for example in Greece in 2013, in Italy in 2014, in France only in 2015. In 2017 there were still 18.8 million unemployed – which is a good 7.5 million fewer than four years earlier. Compared to the period before the financial crisis – i.e. 2007 – unemployment in the EU is still higher, by around 2 million or 12%. However, a distinction must be made between individual countries. The unemployment rate in Cyprus (+213%), Greece (+165%), Italy (+75%), Denmark (+70%) or Spain (+60%) is still much higher than before the financial crisis. However, it is lower in Germany (-46%), Hungary (-41%), the Czech Republic (-33%) and Poland (-28%).
These figures alone suggest that the distribution of unemployment within the EU has become more unequal. The Gini coefficient is usually used to measure inequality. However, this measure has the disadvantage that it is inaccurate for small samples: the EU is a sample of only 28 states. The Hoover coefficient of inequality is more suitable. It can assume values from 0 (complete equality) to 50 (total inequality). This is also understandable to the layman: if one person has 100 euros and the second has nothing, then 50 euros or 50% must be redistributed so that both have the same amount. As in the calculation of the unemployment rate, the number of unemployed is set in relation to the total work force.
According to the study, disparity in the distribution of unemployment in the EU actually increased after the financial crisis – after having fallen significantly until 2008 (Graph 1). What is surprising, however, is that despite the recent easing in the labour market, this disparity has continued to grow. In 2017, the inequality coefficient in the distribution of unemployment climbed to 24. This is a high value and higher than at the turn of the millennium.
What is the situation within individual countries, i.e. with regard to the region? Data are available for the so-called NUTS 2 regions. This is a breakdown of the regions mainly by administrative unit, but not by economic integration. There are pragmatic reasons for this classification. Moreover, it is rather general. In the smaller EU states there is only one region: the state itself. This applies, for example, to Luxembourg, Malta, Cyprus and the Baltic countries. Germany or the UK, on the other hand, have just under 40 regions.
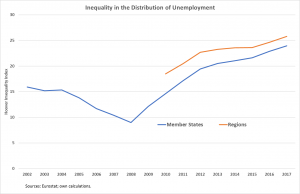
As expected, unemployment is even more unequally distributed among the regions than among the member states in the EU as a whole. In addition to the unequal distribution between the nations, there is also the unequal distribution between the regions within the member states. With a value of 26, however, the inequality coefficient for the regions is not much higher; obviously the inequality in the distribution of the unemployed among the states is decisive.

There has been a more even distribution of unemployment within Greece and Portugal (Figure 2). In Portugal this is due to the fact that there was regional convergence in economic performance. In Greece that was not the case, since previously there was a relatively low regional divergence in economic performance. This more equal distribution of unemployment could therefore be due to migration. In other southern European countries such as Italy and Spain, on the other hand, the opposite can be observed: in the recent past, the distribution of economic output and unemployment has again diverged, after a long period of convergence. Italy is particularly affected by this, as regional differences have always been particularly pronounced there.
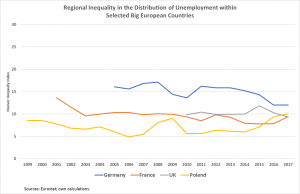
Within Germany, too, unemployment was very unevenly distributed, due to German reunification (Graph 3). In recent years, however, there has been convergence – partly because there has been regional convergence in economic strength. The development in Poland is also striking. For a long time, unemployment was relatively evenly distributed throughout the nation. The financial crisis brought a divergence for a short time – and then a reduction of the differences again. More recently, however, there has been a regional gap in unemployment, which is higher than in the UK or France. In these two countries, however, little has changed in the regional distribution of unemployment, thus the regional divergences are not very great.
The EU Commission has recognised the unemployment problem, especially as it clouds the positive track record it makes claim to. The Commissioners Cretu and Thyssen wrote in the EU’s 7th Cohesion Report: “Though on average economic recovery seems to have taken root, GDP and employment have reached all-time highs and regional disparities are shrinking, all is not well. Looking at the situation more closely, we see that unemployment rates remain above the pre-crisis level in a number of areas while too many small and medium-sized enterprises are struggling to adapt to globalisation, digitalisation, green growth and technology change”. Apart from the fact that in almost every upswing the economic performance is higher than in the previous one, it is either not recognised as such or the EU is in denial that regional differences have increased enormously with regard to unemployment. Instead, the opposite is claimed.
It is also astonishing that existing unemployment is attributed to the fact that small and medium-sized enterprises are said to have paid too little attention to globalisation, digitisation and “green” technology. It fails to provide macro-economic evidence for this assertion, and the statement that distracts from the enormous external imbalances between EU countries, due to the misguided wage policies in some member states (such as Germany) or from growing income and wealth inequalities. But Brussels is creative. For example, one Commission already involved in the Cohesion Report[1] points out that, in view of a sharp increase in the number of people in employment, the fall in unemployment would have been more pronounced if labour participation had not increased[2].
It is true that labour force participation has increased, more than offsetting a demographic decline in labour force potential (especially among younger workers). The number of people aged 15 to 74 in the labour force in the EU increased by 8.3 million between 2007 and 2017. More than three-quarters of this change is attributable to women aged 45 and over, according to an EU calculation. However, this is not due to the fact that these are housewives who have now considered accepting a paid job. Rather, they are women who have always been gainfully employed and have aged over the years. They have replaced the generation of women who had participated very little in working life and who are no longer of working age or died. Actually, it is not a change in working behaviour, but a generational effect. And it did not come suddenly, but was predictable.
The EU Commission´s repeated reference to an increase in employment will be dealt with at the conclusion. In fact, the number of people in employment increased by 7.2 million or 3.3% between 2007 and 2017. In comparison, between 2013 (when unemployment reached its peak) and 2017, it even rose by 12.2 million or 5.6%. These are people, not employment itself – i.e. the hours worked or the volume of work. However, the European Statistical Office (Eurostat) does not provide precise information on the volume of work[3]. Therefore, one can only rely on the weekly working-time data obtained from the Labour Force Survey. Between 2007 and 2017, the average weekly working time of employed persons fell from 37.9 to 37.1 hours, or by 2.2%. In this period the largest part of the increase in the number of people in employment is therefore due to a reduction in working time. Consequently, the volume of work has hardly increased at all. A comparison of the years 2013 and 2017, however, shows a different picture. Here, in the year of an economic nadir a comparison is made with an upswing year. Therefore, working-time effects play only a minor role; in 2013 the weekly working time was only 0.1 hours higher than in 2017. The increase in employment was therefore almost exclusively a measure of the number of individuals employed, not the hours worked.
However, it is not only a question of how long you work, but also of what you achieve. It is therefore a question of labour productivity. In the period from 2007 to 2017, real value-added per person employed in the EU as a whole rose by an annual average of 0.4%. In the period from 2000 to 2007 – also two upswing years – it was still 0.8%. If one compares years of an economic depression with an upswing year, the annual productivity growth per capita is naturally stronger: in the period from 2013 to 2017 it was 0.9%, in the period from 2003 to 2017 it was 1.4%.
Productivity growth is therefore steadily declining. Less and less growth in value-added is necessary in order to maintain the level of the number of people in employment or to increase it. This is definitely good for reducing unemployment statistics. That may be encouraging, but only at a first glance, because the statistics say nothing about the quality of the additional jobs and therefore also do not confirm a better wage development. In any case, there is no information concerning true economic dynamics.
Therefore, the positive promise of the Lisbon Strategy of 2000 to make the EU “the most competitive and dynamic knowledge-based economy in the world” has little relevance today. Apparently the EU has given up on its policy of regional convergence; the regional divide in unemployment is simply being ignored.
[1] European Commission: My Region, My Europe, Our Future. Seventh report on economic, social and territorial cohesion. Brussels 2017, p. iii.
[2] European Commission: Labour Market and Wage Developments in Europe. Annual Review 2018. Luxembourg 2018, p. 11.
[3] Apart from data for agriculture. It is astonishing that no macroeconomic data on the volume of labour are reported, although they are included in the calculation of some indicators within the framework of the National Accounts – such as productivity per hour or unit labour costs.

Be the first to comment