

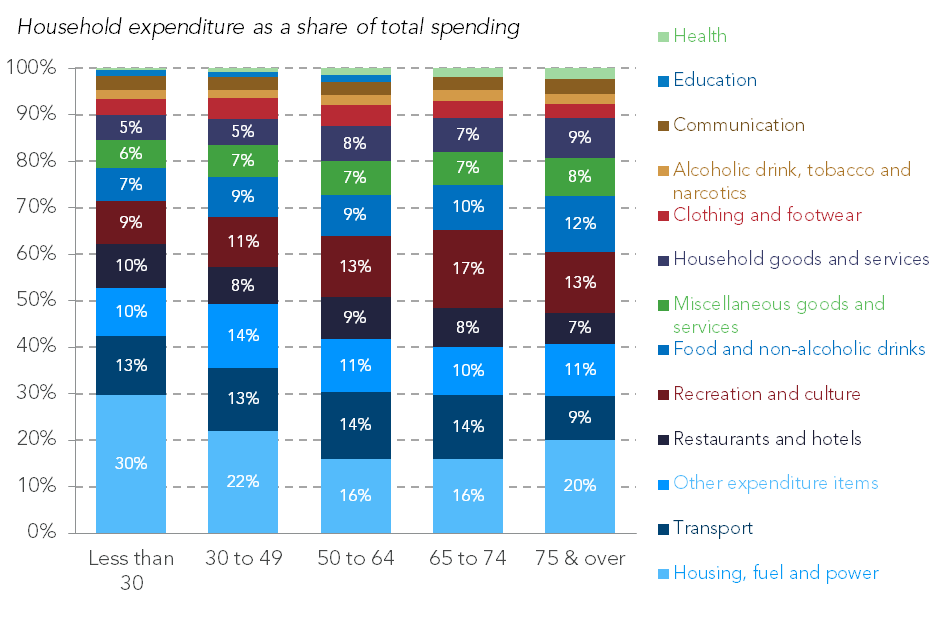
What do people spend their money on? This article provides insights concerning the spending habits of the British, breaking this down into income and age groups. The results are telling.
Todays’ annual Family Spending release contains the usual treasure trove of information on what UK households spent their money on last year. Households spent a lot. Average weekly spending rose (after adjusting for inflation) by 4 per cent from £533 to £554 between 2015-16 and 2016-17 – the sharpest increase for well over a decade and far outpacing income growth (typical household incomes rose by 2.3 per cent).
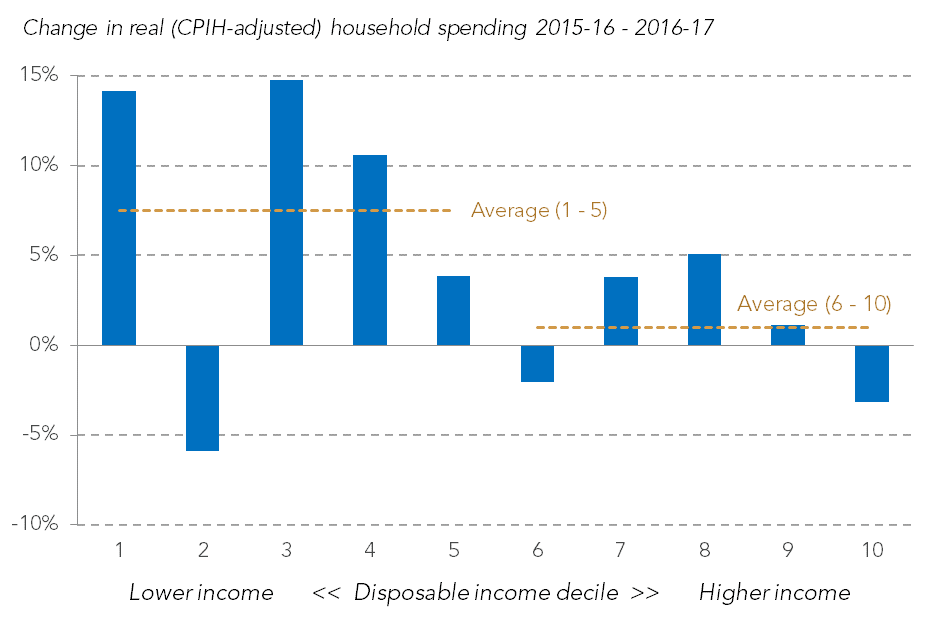
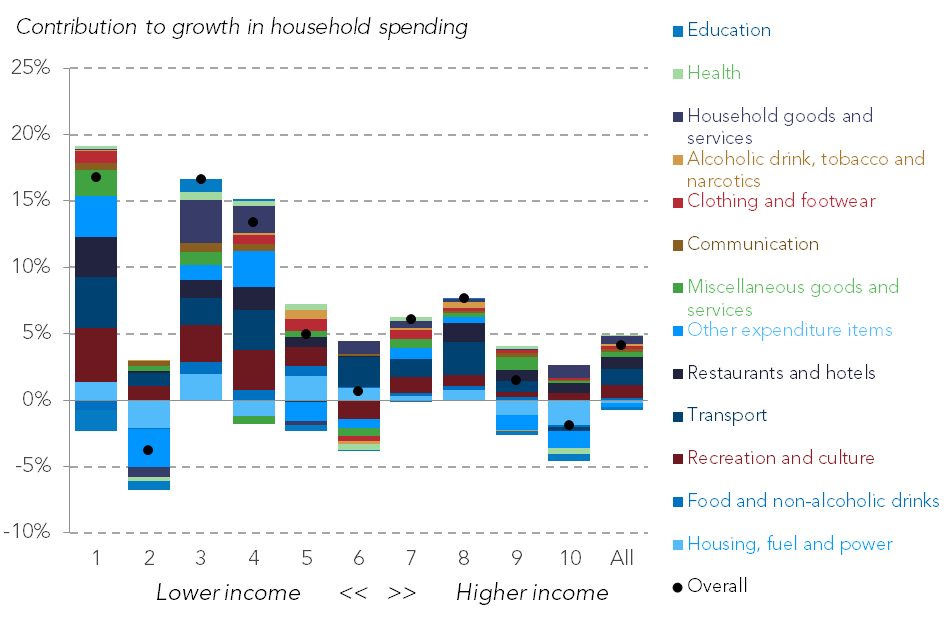
Not only was growth strong, but it disproportionately favoured households in the bottom of the income distribution (as the figure below shows). Household spending grew by an average of 7 per cent for households in the bottom half, and by just 1 per cent for households in the top half.
Over this period households increasingly used credit to fund their spending, foreshadowing the slowdown that occurred in the second half of 2017. One of the limitations of this data being so out of date is that it does not capture the sharp rise in inflation and falling real wages which have defined household finances since last spring. One of its strengths is that it is the definitive source for information about household spending. With that in mind below we set out the Resolution Foundation’s five key charts that explains who was spending what in 2016-17.
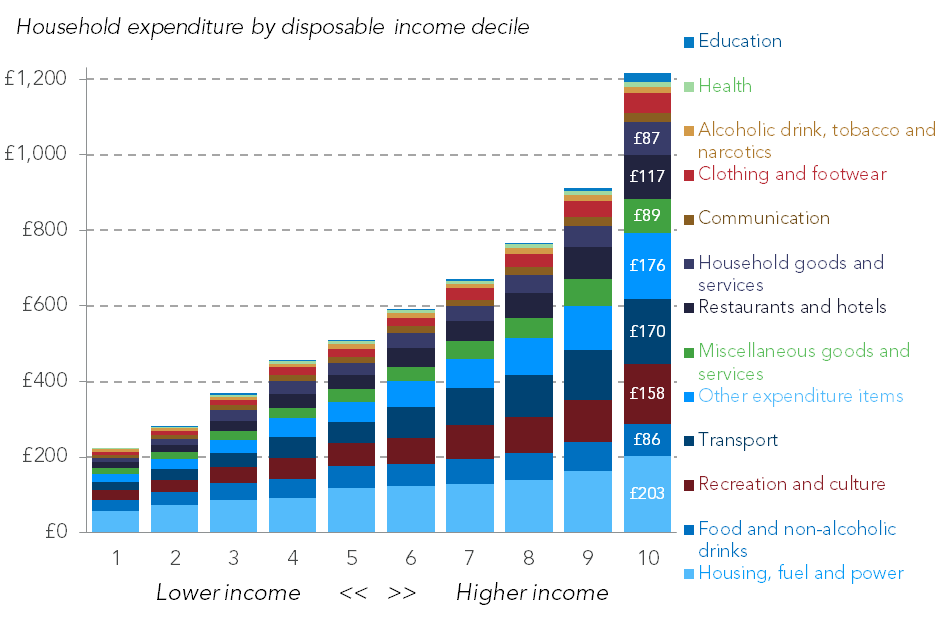
Rich households spend five times as much as poor households. The 10 per cent of households at the top of the income distribution spent an average of just over £1,200 a week in 2016-17 compared to just over £200 for the bottom 10 per cent; 5 times as much. This ratio however is dwarfed by differences in income between these two groups. Incomes at the top are around 9 times higher than those at the bottom (the respective figures were £81,805 and £9,572) showing that – as a proportion of income – richer households save a lot more.
Lower-income households spend far less on transport, recreation and restaurants than higher-income households. 28 per cent of expenditure of the bottom 10 per cent of households is accounted for by spending on these items, compared to 37 per cent for the top 10 per cent. Lower-income households spend far more on essentials: food, drink, clothing and housing.
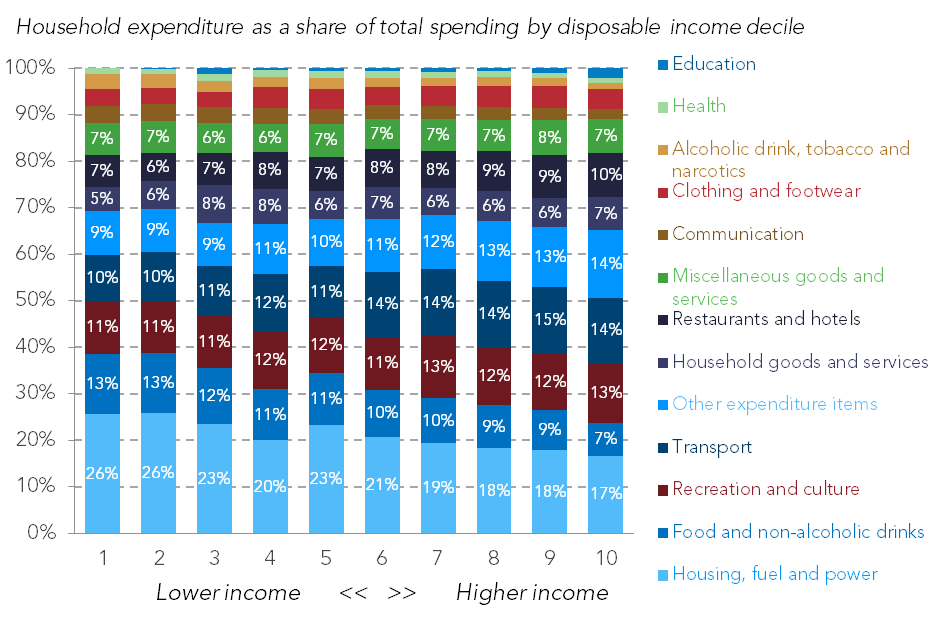
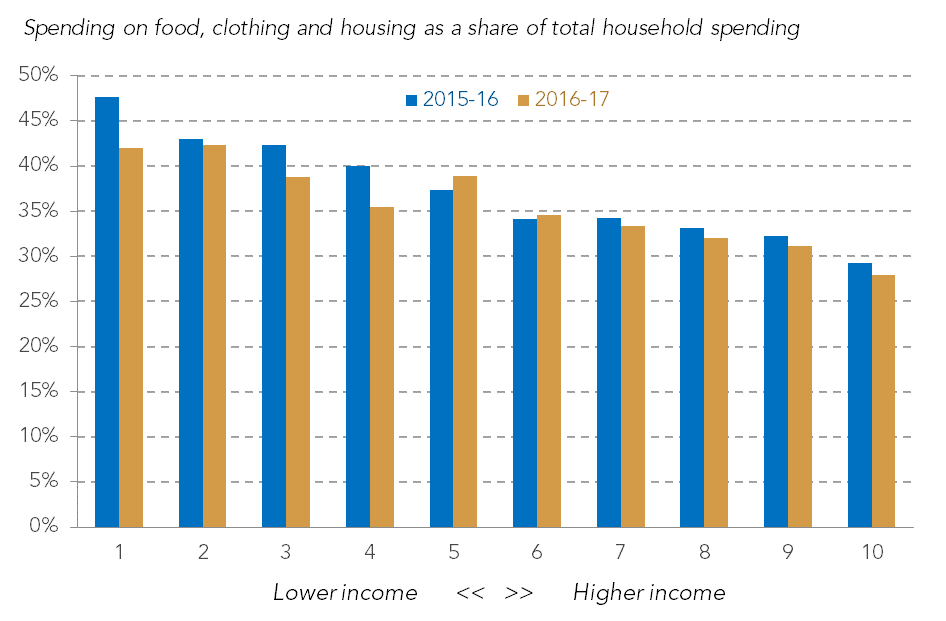
This year households spent less on essentials. Given the sharp increase in spending last year it is perhaps unsurprising that this was largely driven by households being more willing to splash out on non-essentials. The result was that spending on housing, clothing and food fell from 38 per cent to 36 per cent. As the figure below shows this fall was evident across the income distribution with the biggest declines evident in the bottom half.
Households spent more on transport, recreation and restaurants. The biggest contributors to the growth in household spending last year were transport, recreation and culture, and restaurants and hotels. The figure below shows that across the income distribution a significant proportion of the increase in spending was accounted for by these categories. In particular, spending on recreation and cultural activities accounted for – on average – a quarter of the growth in household spending between 2015-16 and 2016-17.
Understanding differences in spending matters. Not only does it help us understand if, and which, households may be overstretching themselves but it also helps explain which households are likely to be most affected by rising prices. Inflation has risen significantly since the data above was collected. Between March and December 2017 the ONS’ headline measure of inflation (CPIH) has risen by 0.4 percentage points, spurred by strong increases in the prices of food, clothing and recreation. Those households that dedicate a higher proportion of their spending to such items will have felt price rises more keenly. For a fuller understanding of who’s feeling the pinch it’s important to know who the big (in a proportional sense) spenders are.

Be the first to comment