Depressing but not a surprise: 2017-2018 was not a good year for living standards progress in Britain, according to new figures from the Office of National Statistics
Adam Corlett, senior economic analyst, Resolution Foundation
Cross-posted from the Resolution Foundation
Today we got the first solid data about household incomes in 2017-18. Unfortunately, the figures today confirm fears that 2017-18 was not a great year for living standards progress. (Though note that the bigger sister to this release, which will give us even better data, especially on poverty, will be out at the end of March.)
Real incomes stagnated
According to today’s stats, the median income fell by -0.1 per cent in 2017-18 after adjusting for inflation. This should not be too much of a surprise. Following the referendum, average consumer prices rose by 2.6 per cent in 2017-18 (using CPIH), while average earnings only increased by 2.4 per cent and working-age benefits were frozen. While employment continued to rise, other big benefit cuts such as the two child limit also started to take effect.
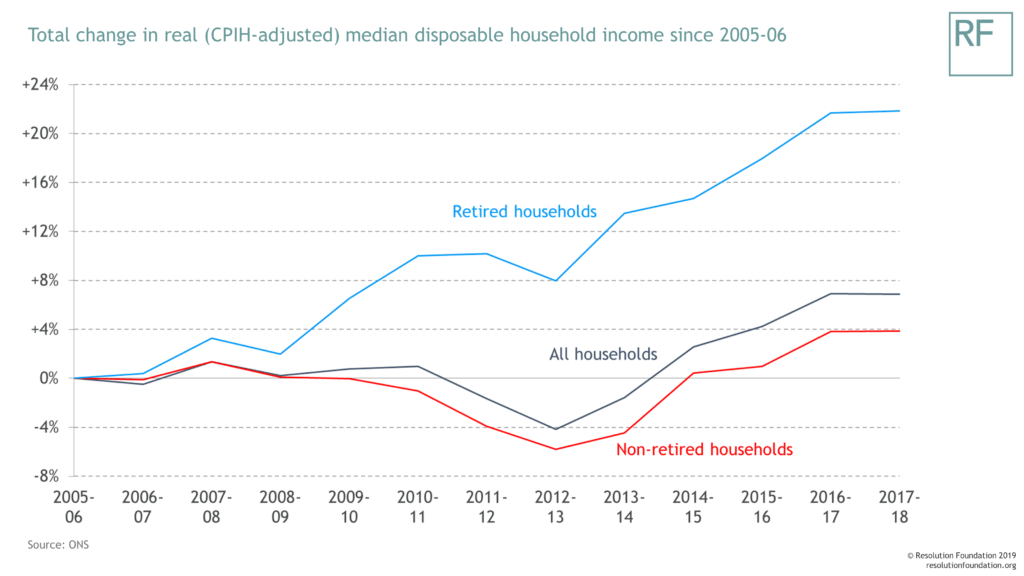
You might think that we should be a period of high income growth as the economy recovers from the financial crisis. Instead, there has been a new squeeze on living standards, leaving the typical non-retired person’s income only 4 per cent higher than twelve years earlier (while the typical retired person is now 22 per cent richer).
Inequality rose
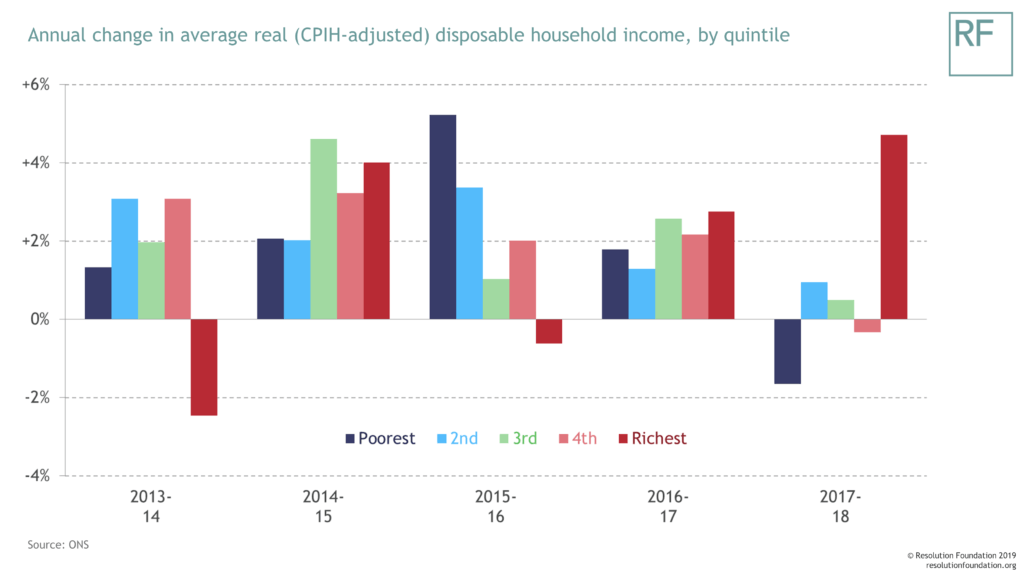
Disposable income inequality rose in 2017-18, according to all four measures published by the ONS (the Gini coefficient, Palma ratio, p90/p80 ratio and s80/s20 ratio). As the chart below shows, the data suggests top incomes grew despite the typical income stagnation, while the poorest fifth became worse off. Such figures can be volatile – as today’s figures are unfortunately still based on a sample size of only around 5,000 households – but they do reinforce our earlier modelling, which suggests that benefit cuts weighed heavily on lower income households in 2017-18.
Inequality will be revised up further
While inequality appears to have increased, there are also important methodological changes in train. The ONS has today also presented experimental results that greatly improve the accuracy of their top income measurement. As the blue and red lines below show, if or when such a change is implemented (likely next year), the Gini coefficient will be revised up and the ONS’s trend will look quite different. Thankfully, when this happens, the ONS’s results will also look very similar to the DWP’s (which already include a top income adjustment). It will take a little more time to get this right, but doing so will represent a big improvement in the UK’s inequality stats.
And some improvements have already been made. Today’s results, for the first time, give all individuals equal weight rather than giving all households equal weight (regardless of size), and this has reduced estimates of historical inequality (see a previous RF report for more detail of this). This is shown in the change from the green line to the blue line.

The risk for Britain is that growth will remain weak, especially for the poorest
Ideally, 2017-18’s weak growth and rise in inequality would be the result of one-off factors. But as we set out in our Living Standards Outlook 2019, released last week, we may not be so lucky. Despite a fall in inflation, a rise in wage growth and good employment figures, the OBR’s projections – together with current government policy – suggest that 2018-19 and 2019-20 look little better.
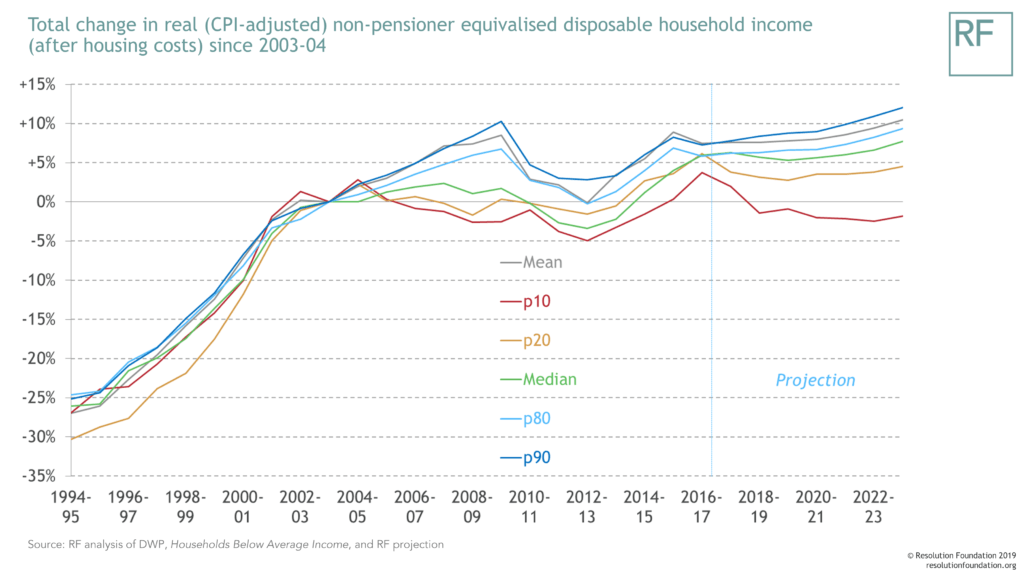
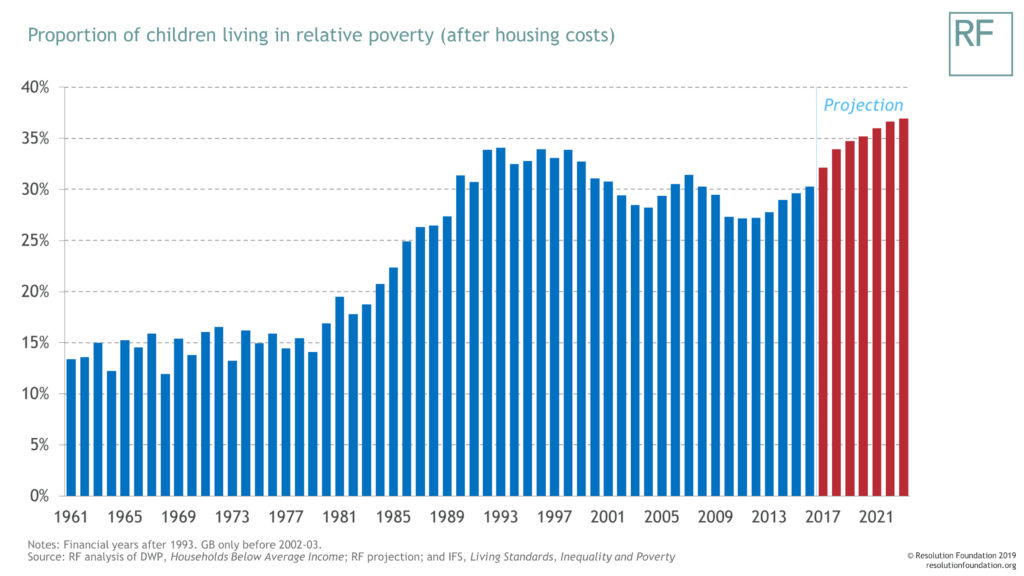
With the benefits freeze and other cuts continuing to hit low to middle income households, the prospects for incomes and poverty remain deeply worrying. Focusing specifically on child poverty, which has been rising 2011-12, our forecasts show that, unless there is a significant change of direction on government benefit policy, levels of relative child poverty could hit record highs by the end of parliament. For now, we must wait another month for official stats on how levels of poverty fared in 2017-18.
Today we got the first solid data about household incomes in 2017-18. Unfortunately, the figures today confirm fears that 2017-18 was not a great year for living standards progress. (Though note that the bigger sister to this release, which will give us even better data, especially on poverty, will be out at the end of March.)
Real incomes stagnated
According to today’s stats, the median income fell by -0.1 per cent in 2017-18 after adjusting for inflation. This should not be too much of a surprise. Following the referendum, average consumer prices rose by 2.6 per cent in 2017-18 (using CPIH), while average earnings only increased by 2.4 per cent and working-age benefits were frozen. While employment continued to rise, other big benefit cuts such as the two child limit also started to take effect.
You might think that we should be a period of high income growth as the economy recovers from the financial crisis. Instead, there has been a new squeeze on living standards, leaving the typical non-retired person’s income only 4 per cent higher than twelve years earlier (while the typical retired person is now 22 per cent richer).

Inequality rose
Disposable income inequality rose in 2017-18, according to all four measures published by the ONS (the Gini coefficient, Palma ratio, p90/p80 ratio and s80/s20 ratio). As the chart below shows, the data suggests top incomes grew despite the typical income stagnation, while the poorest fifth became worse off. Such figures can be volatile – as today’s figures are unfortunately still based on a sample size of only around 5,000 households – but they do reinforce our earlier modelling, which suggests that benefit cuts weighed heavily on lower income households in 2017-18.

Inequality will be revised up further
While inequality appears to have increased, there are also important methodological changes in train. The ONS has today also presented experimental results that greatly improve the accuracy of their top income measurement. As the blue and red lines below show, if or when such a change is implemented (likely next year), the Gini coefficient will be revised up and the ONS’s trend will look quite different. Thankfully, when this happens, the ONS’s results will also look very similar to the DWP’s (which already include a top income adjustment). It will take a little more time to get this right, but doing so will represent a big improvement in the UK’s inequality stats.
And some improvements have already been made. Today’s results, for the first time, give all individuals equal weight rather than giving all households equal weight (regardless of size), and this has reduced estimates of historical inequality (see a previous RF report for more detail of this). This is shown in the change from the green line to the blue line.

The risk for Britain is that growth will remain weak, especially for the poorest
Ideally, 2017-18’s weak growth and rise in inequality would be the result of one-off factors. But as we set out in our Living Standards Outlook 2019, released last week, we may not be so lucky. Despite a fall in inflation, a rise in wage growth and good employment figures, the OBR’s projections – together with current government policy – suggest that 2018-19 and 2019-20 look little better.

With the benefits freeze and other cuts continuing to hit low to middle income households, the prospects for incomes and poverty remain deeply worrying. Focusing specifically on child poverty, which has been rising 2011-12, our forecasts show that, unless there is a significant change of direction on government benefit policy, levels of relative child poverty could hit record highs by the end of parliament. For now, we must wait another month for official stats on how levels of poverty fared in 2017-18.

- If you are tired of complaining about how awful state and corporate media is and wish for more information like this, please donate here. It is up to you.


Be the first to comment