

This may be specifically about Britain, but many tendencies are valid for other European nations.
By Conor D’Arcy, Senior Research and Policy Analyst at the Resolution Foundation
Cross-posted from Resolution Foundation
We get monthly updates on pay and authoritative data on household incomes every year. But we have to wait two years for a detailed breakdown of what’s happening to wealth across Britain. Here are seven key takeaways from the latest data published today and what it tells us about changes in the level, profile and distribution of Britain’s wealth.
-
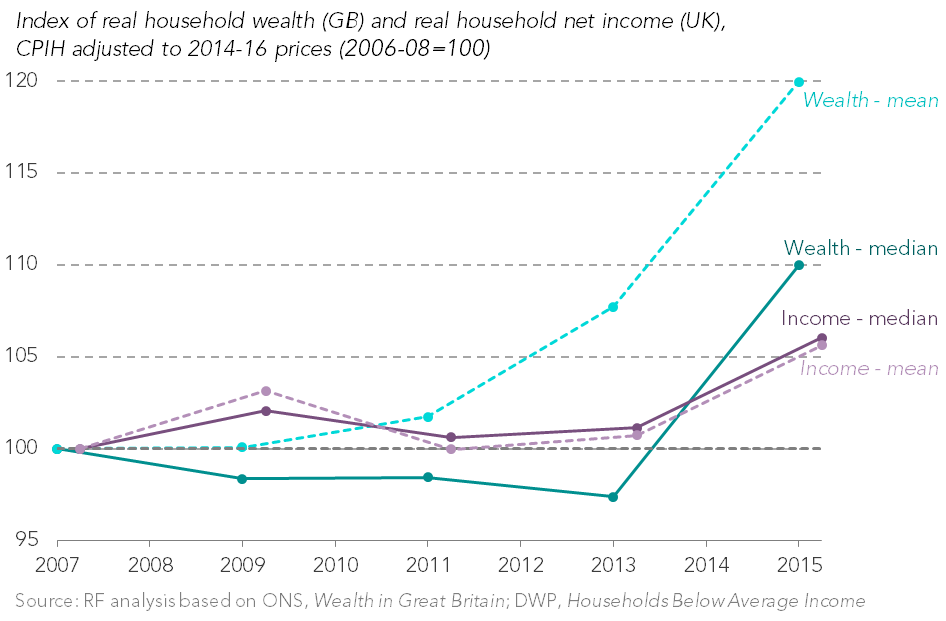
Britain has excelled at generating wealth
Total wealth in Britain stood at £12.8 trillion from 2014-16, a 13 per cent real-terms increase in two years. And this isn’t a one off boost; average net household wealth has risen by 20 per cent over the decade or so covered by the ONS’s Wealth and Assets Survey. That far outstrips the performance of average household incomes, which have risen by just 5 per cent over the same period.
-
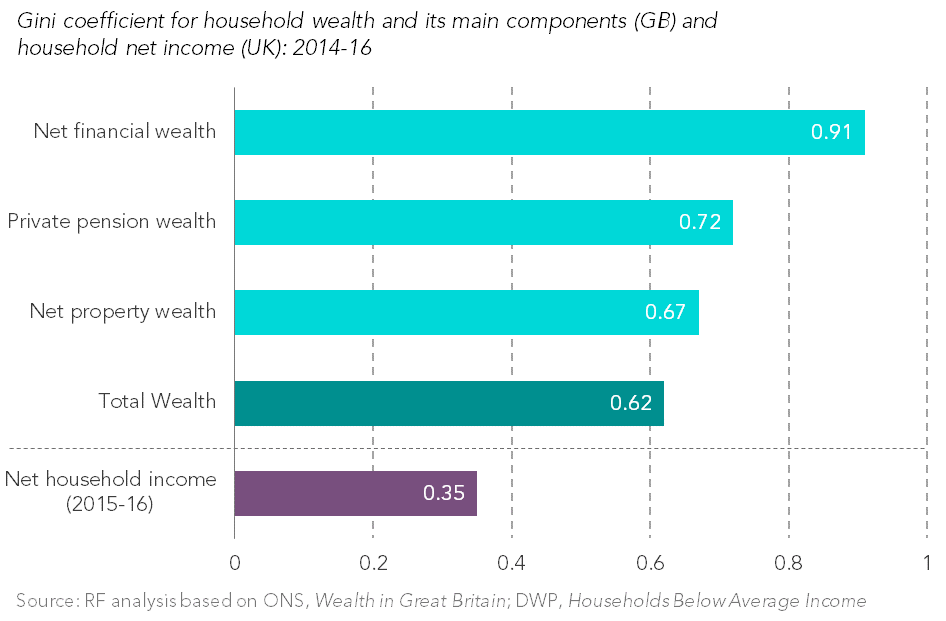
But that wealth is very unequally spread
Britain is great at growing the wealth pie, but rubbish at sharing it out. This is obvious from its Gini coefficient (where 1 would be if one person had all the wealth while 0 would be everyone having the same amount of wealth). With a Gini of 0.62, a figure that has barely changed over the last decade, wealth remains very unevenly distributed, nearly twice as unequal as incomes.
But just tracking these headline changes overlooks trends in certain kinds of wealth. Pension wealth, for example, has become more evenly distributed in recent years with auto-enrolment contributing to the most recent drop. Property wealth on the other hand has become less equally divided, with falling ownership and rising prices meaning a shrinking group who own their own home have experienced significant uplifts in their wealth. That’s in contrast to the pattern of the mid-90s to mid-00s when increased homeownership spread wealth, as documented in previous Resolution Foundation analysis.
-
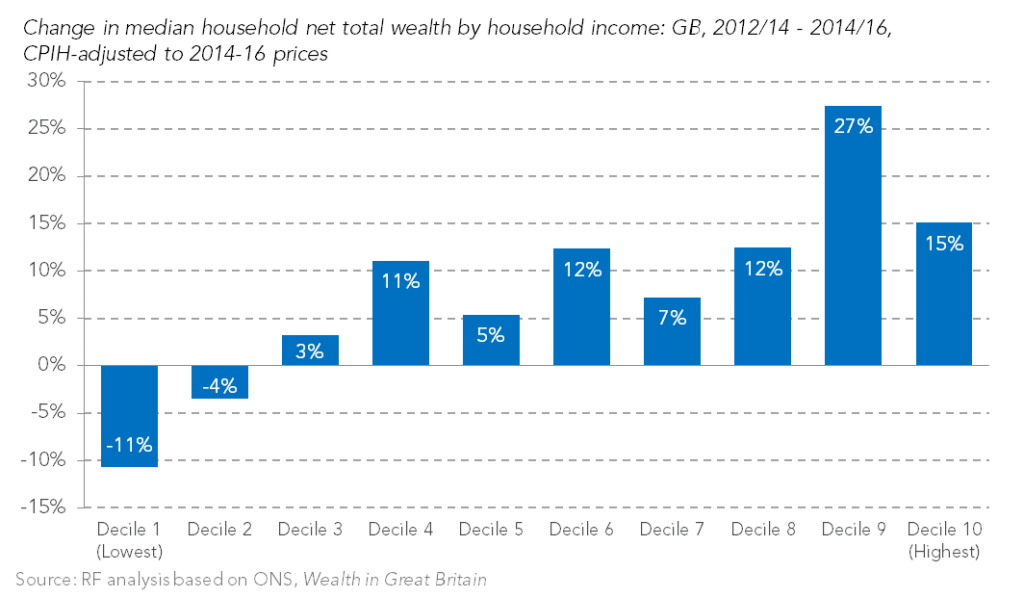
The lowest-income households fared worst in recent years
We can also look at how wealth is held across income levels. Unsurprisingly, the lowest income households have the least wealth. Of greater concern, however, is the pattern of recent years. The typical wealth of the poorest fifth of households fell between 2012-14 and 2014-16. In contrast, households in the ninth decile experienced a 27 per cent increase. Resurgent house prices particularly in London and the South East are likely to have played an important role in this growth at the top.
-
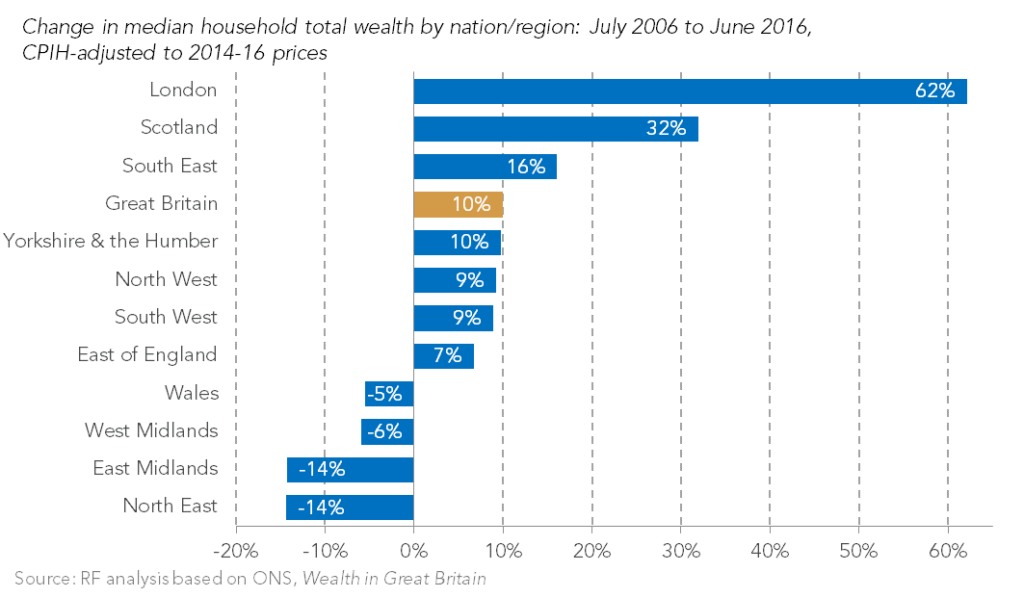
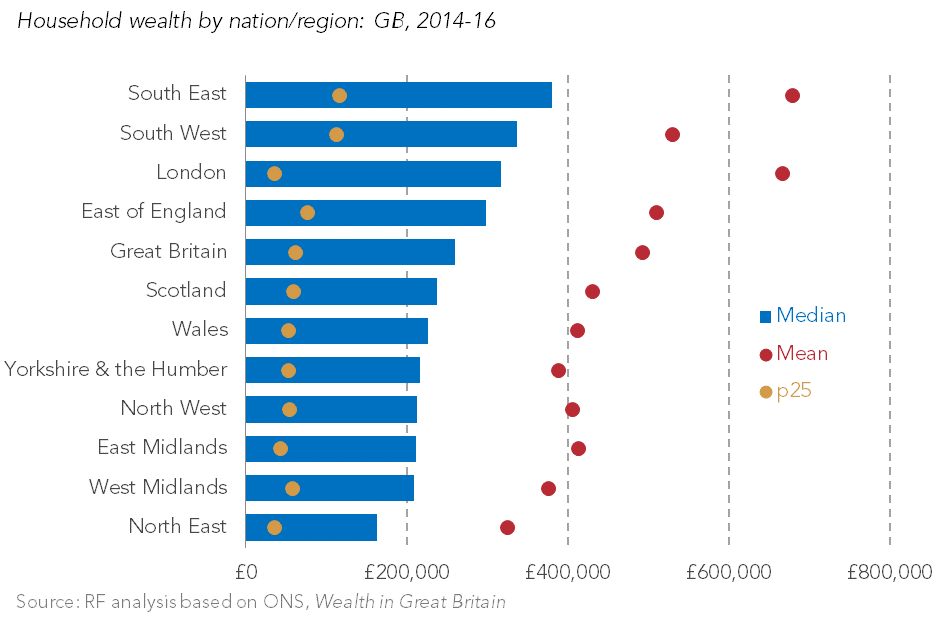
Londoners’ wealth has galloped ahead of the rest of Britain
When it comes to geographical inequality, households in London and the South East are, as you’d expect, wealthier than average. This gap has grown over the last decade as typical household wealth in London has raced ahead of the rest of the country. While median household wealth in London is 62 per cent higher than in 2006-08, in both the North East and the East Midlands it remains 14 per cent lower. House prices again appear to be the main driver of this; typical property wealth in London has doubled over a decade, while it has fallen in real terms in every other region and nation.
-
But there are wide inequalities within London too
Though typical households in London have experienced much faster growth, this does not tell the full story. Less wealthy households in London (those a quarter of the way up the distribution, or ‘p25’) have £35,000, lower than any other nation or region. London’s younger and larger immigrant populations are likely to play some role in this as well as the high cost of housing.
-
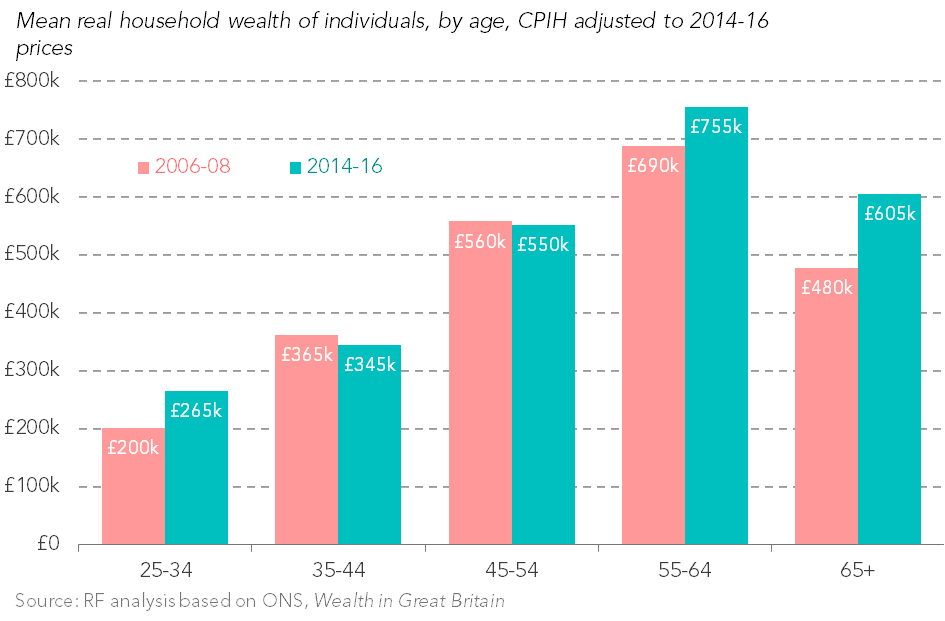
Rising wealth has not been equally shared across the generations
It’s no shock that younger people have less wealth than older households. But comparing the wealth held by those in their 30s today to the wealth of those in their 30s nearly a decade ago can tell us whether today’s young people are keeping pace with their predecessors. Real average household wealth has fallen over the past decade for 35-55 year olds, but increased by a quarter for those aged 65+. While growth is also visible for those aged 25-34, some of this is likely to be due to more of them living in parents’ homes as this data focuses on households.
-
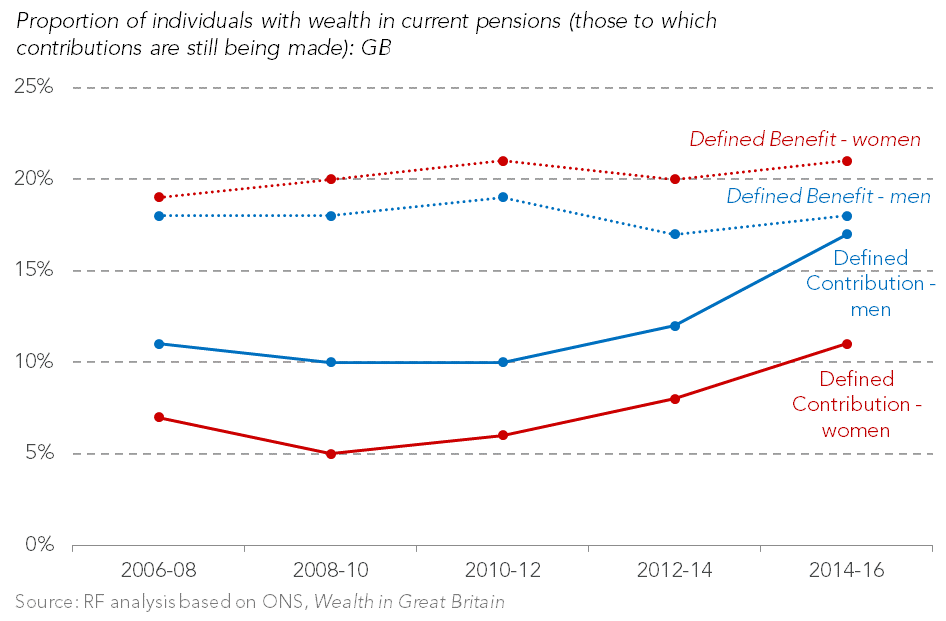
Auto-enrolment has helped but the fall in pensions inequality pre-dates it
While many of these housing-related trends seem unlikely to be reversed in the short term at least, the picture on pension wealth is a reminder of the power of well-designed policy interventions. Auto-enrolment has helped 9.2 million employees to save towards their future, with women and younger workers among the main beneficiaries. It’s worth noting, however, that when it comes to what’s driven falling pension wealth inequality, it’s not all about auto-enrolment. After all, the Gini coefficient for pension wealth fell most between 2008-10 and 2010-12, before its introduction.
In summary, Britain has lots of wealth – and lots more than it did a decade ago. But Britain is also a country of major wealth divides that cut across income levels, regions and generations. What’s most remarkable of all, though, is the lack of debate about whether these trends are good or bad – and what policy can do to change it. Given the huge economic pressures Britain faces in the coming years and decades, it’s high time we had a proper debate about the scale, distribution and taxation of our wealth. That’s a debate our Intergenerational Commission will be looking to spark in the coming weeks and months.

Be the first to comment