
Analysing the power of asset prices in predicting crisis episodes: the authors construct a new ‘mispricing risk’ index
Tristan Hennig is an Economist in the Regional Studies Division at the IMF’s Asia and Pacific Department; Plamen Iossifov is a Deputy Division Chief in the Debt Policy Division of the IMF’s Strategy and Policy Review Department; Richard Varghese is an Economist in the Macrofinancial Unit within the same department
Cross-posted from VoxEU

Creative Commons
Financial crises typically emerge after credit-fuelled surges in asset valuations eventually end. This column analyses the power of asset prices in predicting crisis episodes. The authors construct a new ‘mispricing risk’ index which captures periods of rapid asset price growth and low asset price volatility. This index peaks around one to three years prior to a crisis, making it a suitable metric for monitoring systemic risks. Furthermore, it outperforms the main credit-based metrics used as early warning indicators and offers a superior trade-off between true positive and false positive rates.
Recent bank runs in the US and Europe have rekindled interest in the predictability of systemic financial crises. Their potential to cause broad financial distress and the nature of their subsequent resolutions once again raise a timeless question: Why is it that financial systems remain fragile, and occasionally, without warning it would seem, collapse? (Cecchetti 2022).
The anatomy of a crisis
Often triggered by a change in the price of risk, costly financial crises typically emerge after credit-fuelled surges in asset valuations. When the credit boom peaks, asset bubbles burst, triggering fire sales and debt defaults. Lenders experience losses and curtail credit provision, amplifying the downturn through a textbook financial accelerator (Bernanke et al. 1999).
This boom-bust sequence aligns with the ‘financial instability hypothesis’ of Minsky (1977). During good times, stability breeds instability as both lenders and borrowers underestimate or ‘misprice’ risk. Kindleberger (1978) chronicles how this myopia routinely gives rise to manias and panics that can lead to systemic crises. The latter are extreme realisations of systemic risk, which captures the potential for disruption in the provision of financial services caused by impairment of all or parts of the financial system with serious negative effects for the real sector (IMF et al. 2009).
Recent empirical literature on the topic has focused on the forward-looking predictive power of credit aggregates, such as the credit-to-GDP gap and credit growth (Borio and Lowe 2002, Schularick and Taylor 2012). More recently, Greenwood et al. (2020) show that financial crises are a function of past credit and asset price growth and thus highly predictable. In our recent paper (Hennig et al. 2023), using a large panel of advanced and emerging economies, we further this line of enquiry by demonstrating that a combination of rapid asset price growth and low asset price volatility is a better predictor of future financial crises than early warning indicators proposed in the literature.
The predictive content in asset prices
Iossifov and Dutra Schmidt (2021) decompose systemic risk into solvency, liquidity, and mispricing risk. They demonstrate that out of the three, only mispricing risk is procyclical and leads the credit cycle, making it a promising candidate for policymakers to monitor. We put this hypothesis to the test by examining the power of mispricing risk in predicting future financial crises vis-à-vis other early warning metrics.
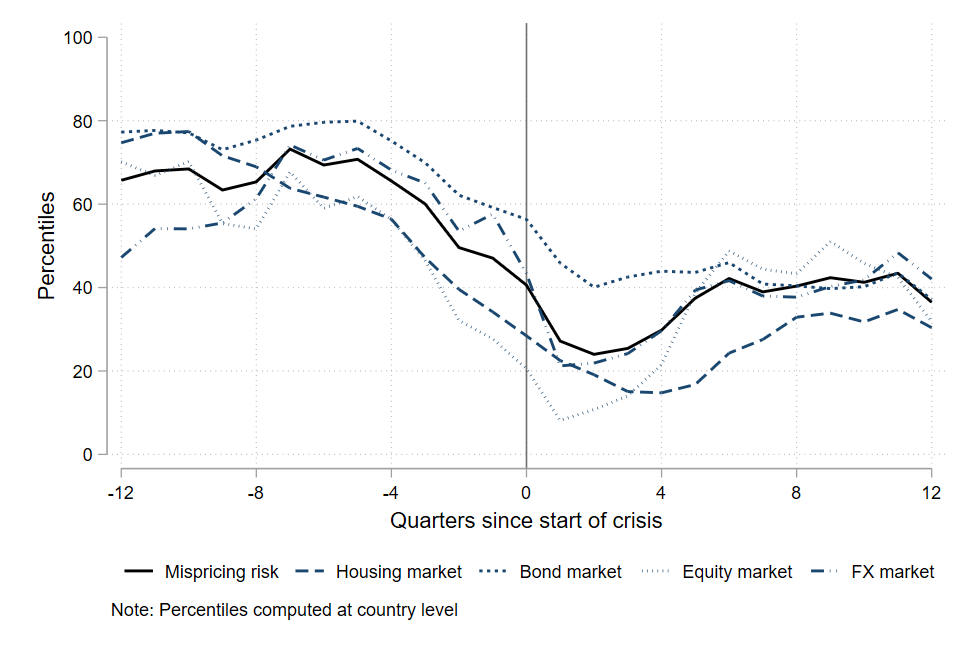
“Mispricing Risk” is a composite indicator capturing high asset price growth and low asset price volatility. It comprises of six variables spanning four asset markets: equity markets (real equity market returns and equity market volatility), bond markets (domestic sovereign bond yield volatility and sovereign foreign exchange risk spreads), foreign exchange markets (foreign exchange market volatility), and housing markets (real house price growth). First, we transform these variables into their within-country percentiles, such that higher percentile values imply higher asset price growth or lower asset price volatility. Next, we aggregate the transformed variables by averaging at the asset market level. Finally, we average across asset markets to build an economy-wide index, effectively giving each market equal weight. Consequently, a high reading for Mispricing Risk captures synchronised risk-on sentiment across asset classes. In other words, Mispricing Risk proxies exuberant asset price growth and muted asset price volatility and risk premia, as defined by historical experiences of each country.
Figure 1 presents a stylised event analysis plotting the evolution of the economy-wide Mispricing Risk (and its individual asset market components) around the incidence of financial crises as defined by Laeven and Valencia (2020). It shows that the indicator is procyclical and peaks one to three years ahead of crises which makes it a suitable candidate for raising risk flags for extreme materialisation of systemic risk.
Figure 1 Mispricing risk and components: Evolution around crises

The classification problem
Suppose that a policymaker with access to several early warning indicators needs to decide whether they should predict that a crisis will occur in the near future. Which indicator should the policymaker rely on? Using quarterly data for 108 countries from 1995Q1 to 2017Q4, and the Laeven and Valencia crises classification scheme we benchmark the performance of Mispricing Risk against three standard credit metrics – the credit-to-GDP gap, the three-year change in the credit-to-GDP ratio, and real credit growth – using receiver pperating characteristics (ROC) curve analysis. We calculate the historical predictive performance of each indicator by computing the empirical true positive and false positive rates. Varying thresholds traces out the ROC curve which summarises the trade-off between precision (few false positives) and sensitivity (few false negatives) for each indicator. The area under the curve then serves as a comparator between indicators with a higher area under the curve indicating a more favourable precision versus sensitivity trade-off for the policymaker.
Figure 2 plots the ROC curves for Mispricing Risk and the three credit-based early warning indicators. It shows that Mispricing Risk outperforms all three credit-based metrics along the whole curve, meaning that it offers a superior trade-off between true positive and false positive rates.
Figure 2 Mispricing risk versus credit metrics: Receiver operating characteristics curves

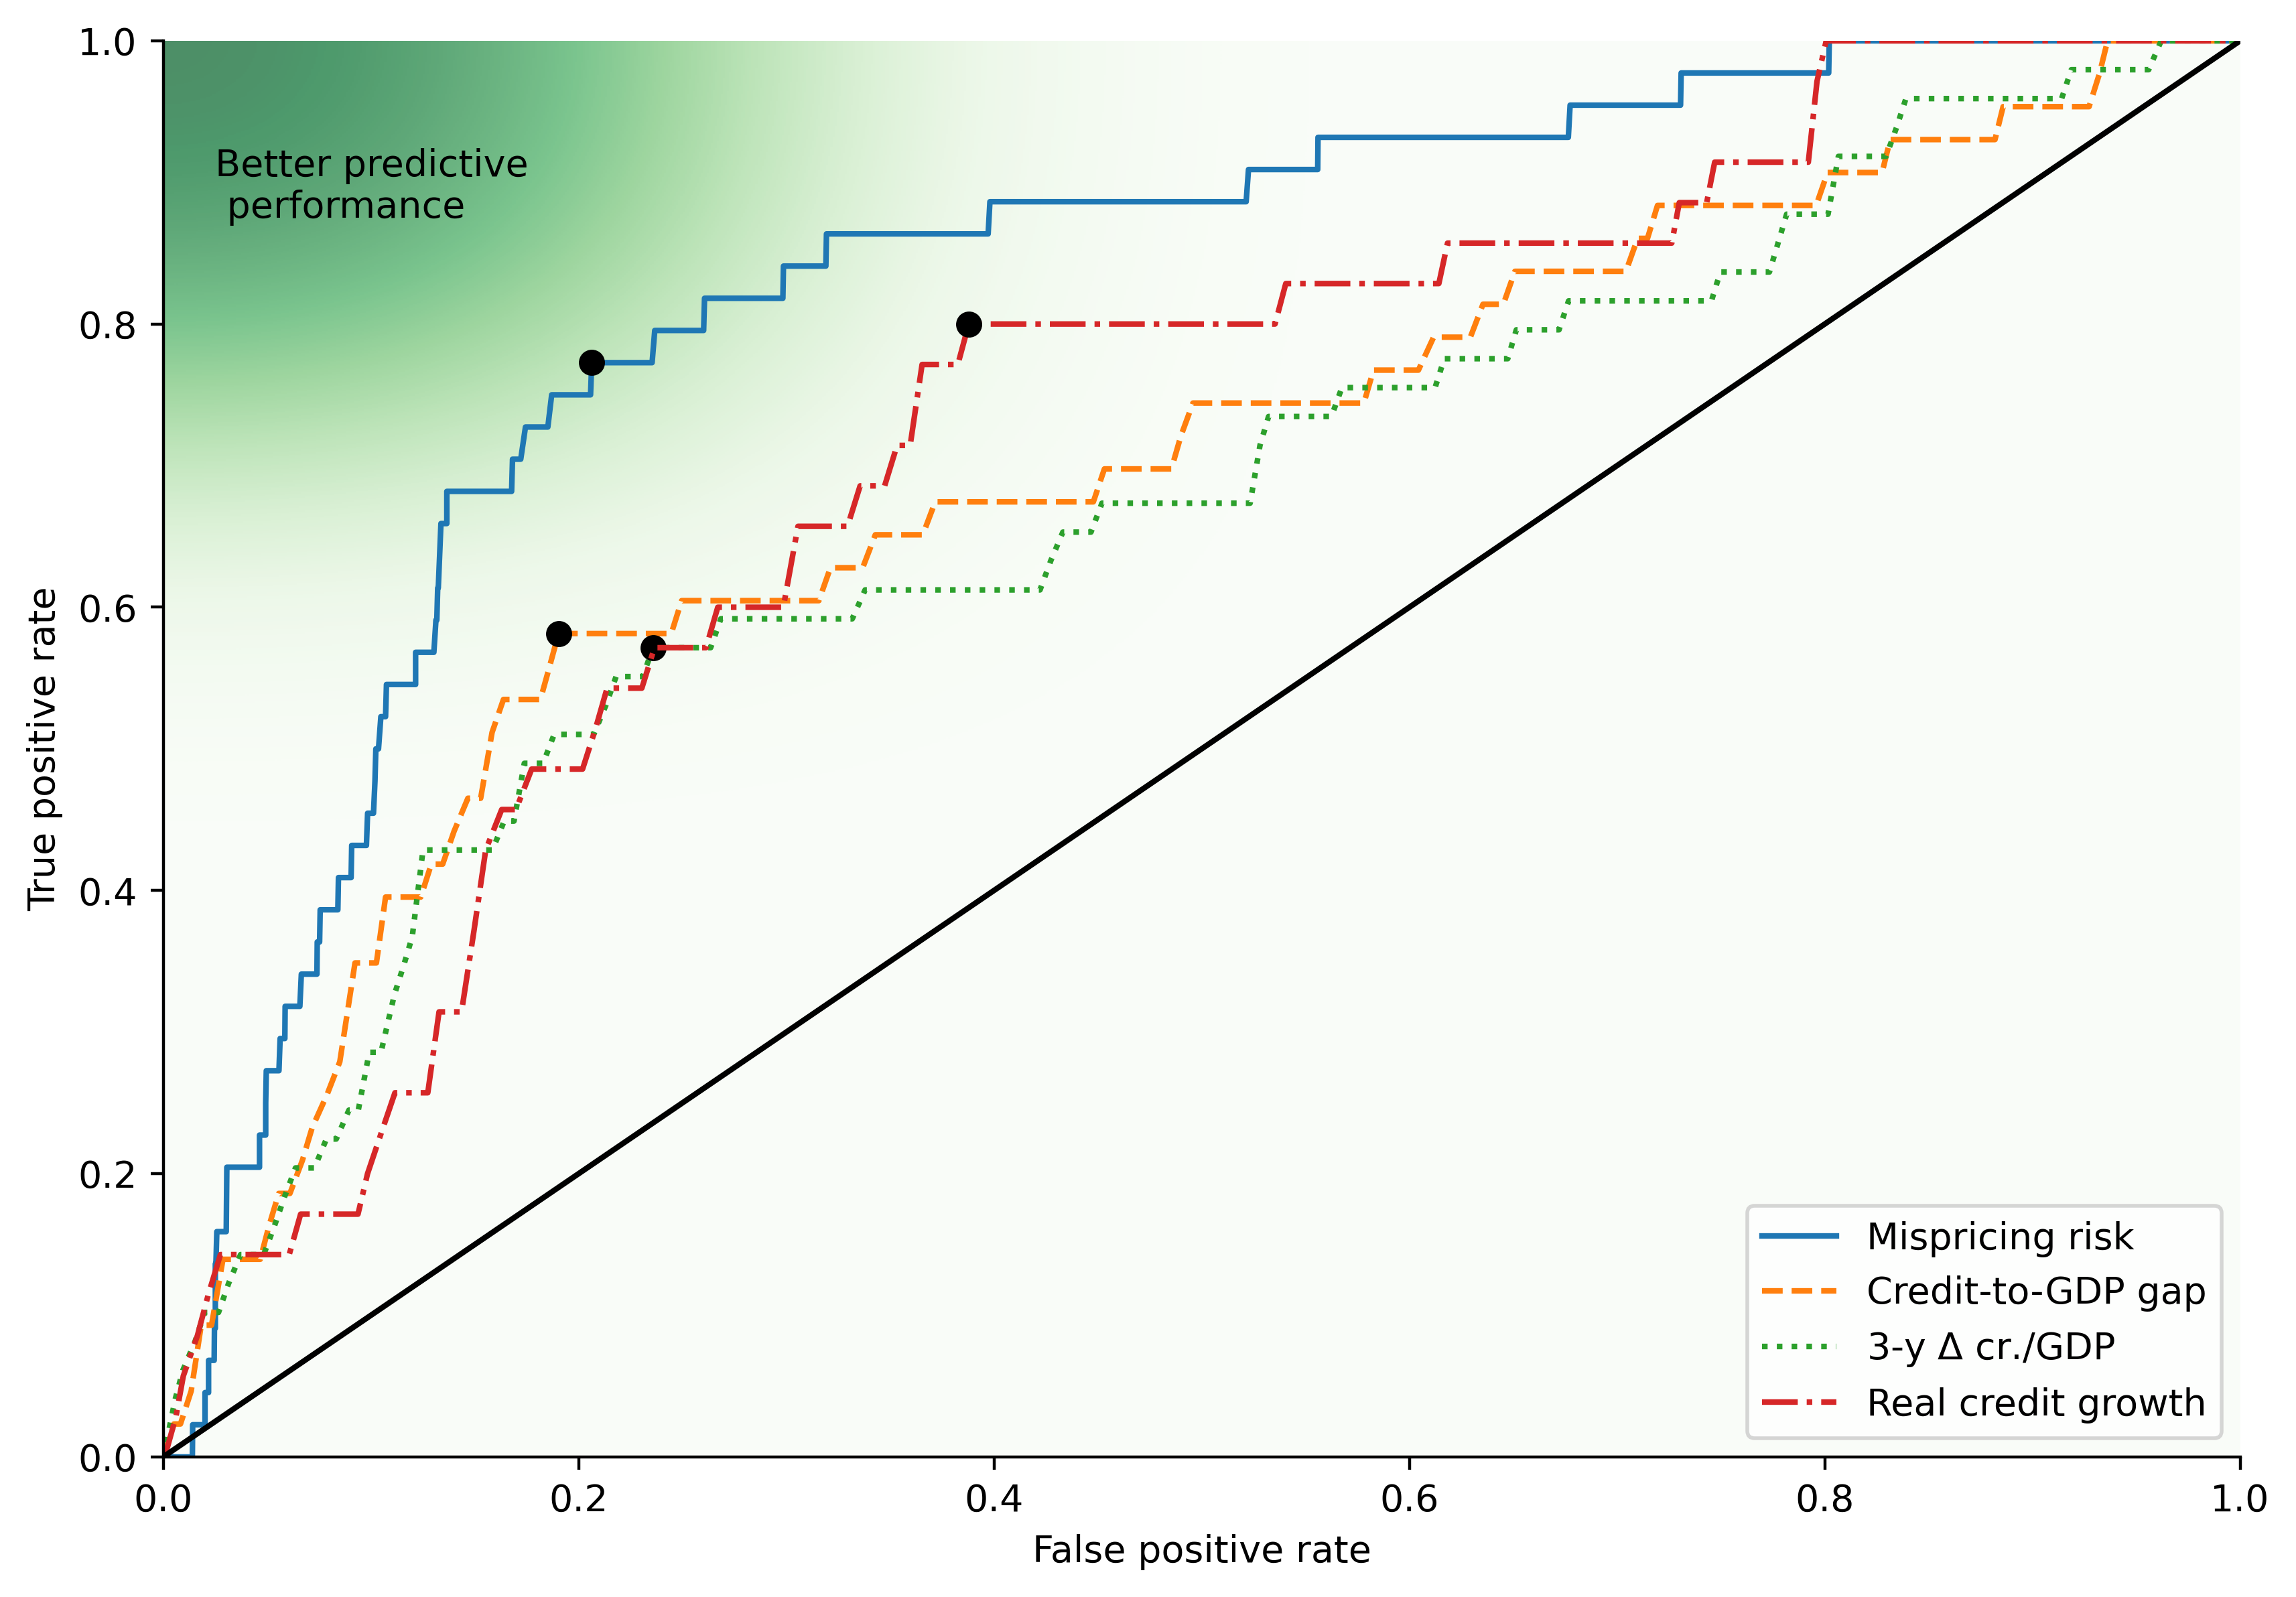
Notes: This figure shows the receive operating characteristics (ROC) curves for mispricing risk and three credit-based early warning indicator (credit-to-GDP gap, three-year change in ratio of credit to private sector to GDP, and real credit growth). The black dot on each ROC curve identifies the optimal point for each early warning indicator as identified by Youden’s J statistic (i.e., the point on the ROC curve which maximises the distance between True Positive Rate and False Positive Rate).
Asset price growth and volatility metrics alone provide more accurate signals, with Mispricing Risk correctly calling 83% of crises six quarters ahead versus only 65% for the best credit metric. Moreover, based on multiple iterations of ROC curve analyses, we establish an optimal threshold of the 66.7th percentile for Mispricing Risk which offers a favourable sensitivity versus specificity trade-off.
Critically, this pattern holds in both advanced and developing countries, and is also confirmed in linear probability estimations. Moreover, the indicators underpinning Mispricing Risk are readily available in most jurisdictions. This suggests that augmenting credit data with asset prices can meaningfully improve systemic risk surveillance across diverse economic settings.
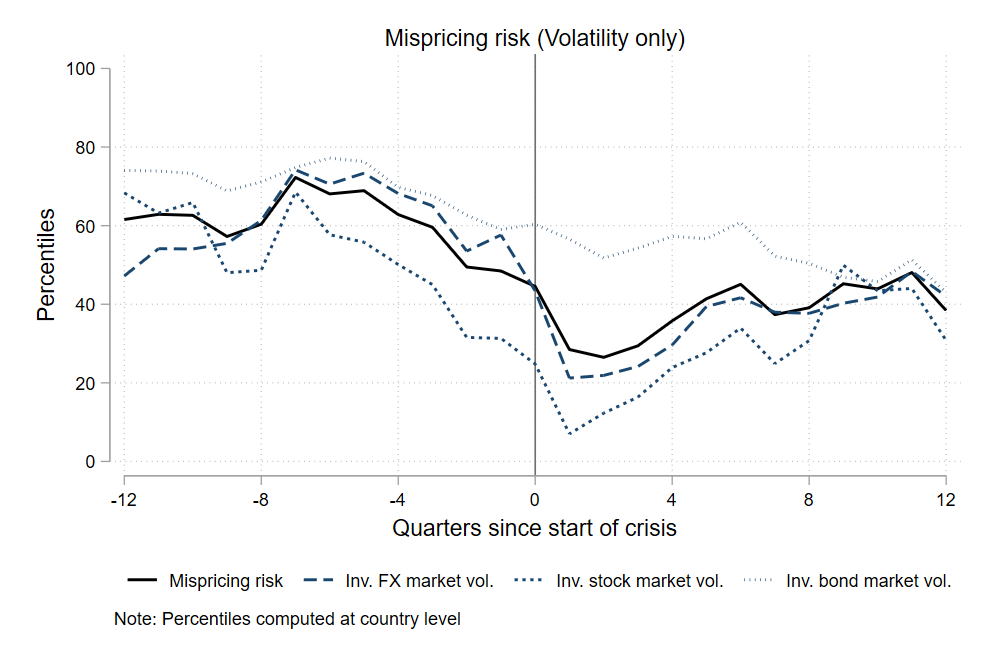
Another statistical regularity we document in this process is that muted levels of asset price volatility can help identify periods of future financial distress. Figure 3 shows the evolution of the volatility component of Mispricing Risk around crises confirming that periods of unusually low (but not high) volatility precede financial crises, a pattern that again holds true across asset markets and in advanced and developing countries.
Figure 3 Mispricing risk (volatility) components: Evolution around crises

How should policymakers respond?
The evidence implies that policymakers should closely track both credit aggregates and asset price dynamics when assessing threats to financial stability. However, determining appropriate responses remains challenging and inevitably requires difficult trade-offs between false alarms and missed crises. In advanced economies, we estimate that the probability of a crisis over the coming 12 quarters rises from around 8% to around 30% when Mispricing Risk is highly elevated. In such a scenario, some macroprudential tightening appears prudent given the substantial and persistent negative effects of financial crises on economic activity (Sufi and Taylor 2022).
Overall, our indicator serves as a useful data point for policymakers when calibrating their macroprudential policy stance. Tracking it can help with the timing of policies that lean against further build-up of systemic risk (such as measures curtailing credit growth).
Future crises will doubtless exhibit new features. But tracking both credit and asset price metrics, including muted asset price volatility, provides policymakers with the best statistical early warning system currently available. In an uncertain environment, these tools remain invaluable for pre-empting excessive risk-taking that could trigger the next crisis.
Authors’ note: The views expressed are those of the authors and do not necessarily represent the views of the IMF, its Executive Board, or IMF management.

Be the first to comment