Michael Roberts looks at inequality, which is reaching new highs. The same forces that are thus debilitating society are equally debilitating the economic system that is alimenting this inequality.
Michael Roberts is an Economist in the City of London and prolific blogger
Cross-posted from Michael Roberts Blog

The US Federal Reserve governor Lael Brainard, in a speech in Washington, revealed the extent of rising inequality in the US. Using the latest income and wealth data, she outlined that the incomes and wealth of working-class (the American establishments like to use ‘middle-class’) households in the US have been squeezed in the last 50 years and particularly in the last 20 years.
Average American households have still not fully recovered the wealth they lost in the Great Recession. At the end of 2018, the average middle income household had wealth of $340,000 (mainly a home), while those in the top 10% had $4.5 million, up 19% from before the recession. The latter’s rise was mainly due to the surge in the stock market.
According to the Fed’s consumer survey, one third of middle income adults say they would borrow money, sell something or not be able to pay an unexpected $400 expense. One fourth said they skipped some kind of medical care in 2018 because of its cost. Nearly three in 10 middle-income adults carry a balance on their credit card most or all of the time. Meanwhile the share of income spent on rent by middle class renters rose to 25% in 2018 from 18% in 2007, a rise of 40%.
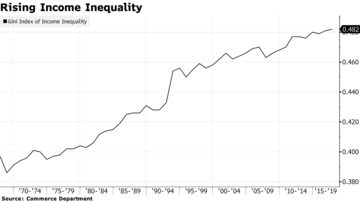
The gini coefficient (the basic measure of inequality) for incomes is now at its highest ever in the US, at a record breaking 0.48 up from 0.38 in the late 1960s – a rise of 30% (see graph above).
Brainard suggested that so bad is this development that reasonable living standards for most Americans will never return. “In recent years, households at the middle of the income distribution have faced a number of challenges,’’ Brainard said. “That raises the question of whether middle-class living standards are within reach for middle-income Americans in today’s economy.’’
Such a situation also threatened to weaken the economy with lower consumption per person. “Research shows that households with lower levels of wealth spend a larger fraction of any income gains than their wealthier counterparts. That has long-term implications for consumption, the single biggest engine of growth in the economy” she said. And it even risked ‘democracy’ itself. “A strong middle class is often seen as a cornerstone of a vibrant economy and, beyond that, a resilient democracy,’’ she said. Such are the fears of one of the members of the pillars of American capital, the Federal Reserve.
While the ‘middle-class’ in the US and many other advanced capitalist countries is being squeezed, the top 1% and even more, the top 0.1%, have never had it so good. It’s as though the Great Recession never happened.
The wealth of the world’s richest people did decline by 7% to $8.56 trillion in 2018, Wealth-X said, citing global trade tensions, stock-market volatility a slowdown in economic growth. And the number of billionaires fell 5.4% to 2,604, the second annual fall since the financial crash a decade ago. But the America’s richest fared the best of the three main regions, recording a slight rise in the number of billionaires of 0.9% to 892, even if their wealth fell by 5.8% to $3.54 trillion.
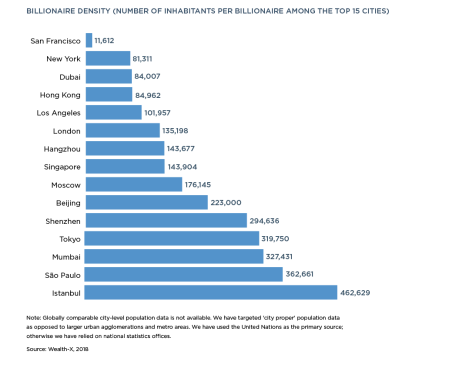
San Francisco has more billionaires per inhabitant in the world — with one billionaire for approximately every 11,600 residents — followed by New York, Dubai and Hong Kong.
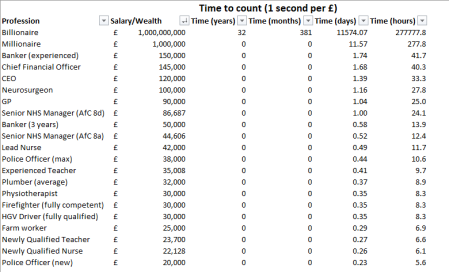
There has not been a fall in billionaires in Brexit Britain, however. According to the Sunday Times rich list just published, there are a record 151 billionaires in the UK. And to be a billionaire is like a god in the sky compared to the average wealth of households. If we measure the difference in time, say days, it is staggering. An NHS nurse’s annual salary is like half a day, while a billionaire’s is like 11,500. The billionaire’s income has a 32 year gap!
Like climate change and global warming, inequality around the world has now reached an irreversible tipping point. The UK-based House of Commons Library reckons that, if current trends continue, the richest 1% will control nearly 66% of world’s money by 2030. Based on 6% annual growth in wealth, they would hold assets worth approximately $305 trillion, up from $140 trillion today. This follows a report released earlier this year by Oxfam, which said that just eight billionaires have as much wealth as 3.6 billion people — the poorest half of the world.
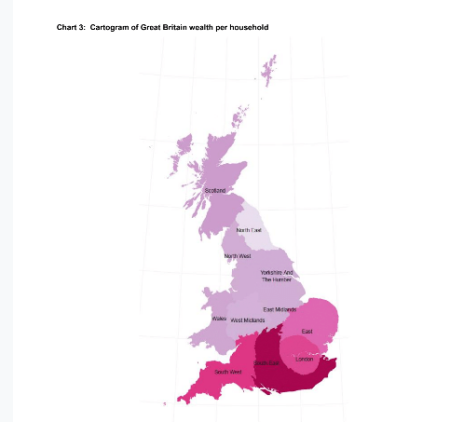
Chief Economist at the Bank of England Andy Haldane also delivered an insightful study of how in Britain the rich and poor are spread across the country. From his home town, Sheffield in northern England, Haldane showed that wealth and income are heavily concentrated in the south-east of England. Indeed, the UK has the worst regional dispersion of income and wealth in Europe – even worse than Italy.
Income and wealth are concentrated in London and the south-east, although long hours and travel time seem to make Londoners more miserable than their poorer fellow citizens in the north, according to surveys.
Rising inequality is creating conditions for rising risk and uncertainty in capitalist economies. That’s because the main way that the inequality of wealth has increased is through rising prices of financial assets. Marx called these assets fictitious capital, as they represented a claim on the value of companies and government that may not be reflected in the value realised in the earnings and assets of companies or government revenues. Financial crashes are regular occurrences, often of increased severity, and they can wipe out the ‘value’ of these assets at a stroke. Such crashes can be triggers for a collapse in any underlying weakness in the productive sectors of the capitalist economy.
The latest report of the US Federal Reserve on the financial stability in the US makes sober reading.
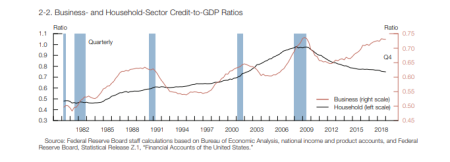
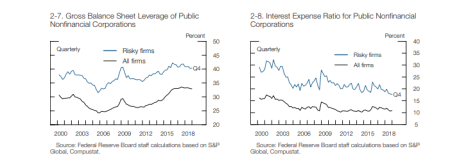
According to the report, “Borrowing by businesses is historically high relative to gross domestic product (GDP), with the most rapid increases in debt concentrated among the riskiest firms amid signs of deteriorating credit standards.” Interest rates for loans are near historic lows, so the borrowing binge among companies continues. According the Fed, “Debt owed by the business sector, however, has expanded more rapidly than output for the past several years, pushing the business-sector credit-to-GDP ratio to historically high levels.”
Moreover, “The sizable growth in business debt over the past seven years has been characterized by large increases in risky forms of debt extended to firms with poorer credit profiles or that already had elevated levels of debt.”
And this borrowed money is not used to invest in productive assets but to speculate in the stock market. Indeed, the main buyers of US stocks are companies themselves, thus driving up the price of their own shares (buybacks).
As long as interest rates stay low and there is no major collapse in corporate earnings, this scenario of corporate borrowing and stock market buybacks can continue. But if interest rates should turn up and/or profits fall, then this corporate house of cards could tumble badly. As the Fed puts it: “Even without a sharp decrease in credit availability, any weakening of economic activity could boost default rates and lead to credit-related contractions to employment and investment among these businesses. Moreover, existing research suggests that elevated vulnerabilities, such as excessive borrowing in the business sector, increase the downside risk to broader economic activity.”
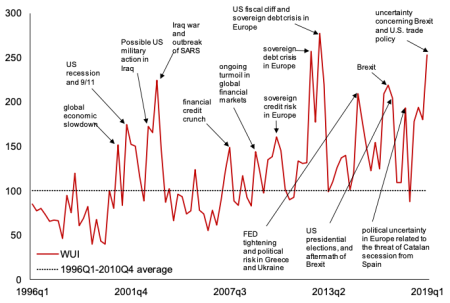
Naturally, the Fed’s report concluded that things were going to be all right and the banks and corporations were resilient and healthy. But overall uncertainty about the future for the major capitalist economies is rising, according to the latest reading of the World Uncertainty Index, a device that supposedly measures the confidence of capitalist investors globally.
The latest measure of the WUI has risen sharply to a level higher than before the global financial crash. And the recent drop in share prices driven by the ongoing trade war between the US and China is an indication of what could happen in the next year.


Be the first to comment