
A wider lens on the dynamics driving the Silicon Valley Bank collapse.
Michael Roberts is an Economist in the City of London and a prolific blogger.
Cross-posted from Michael Roberts’ blog

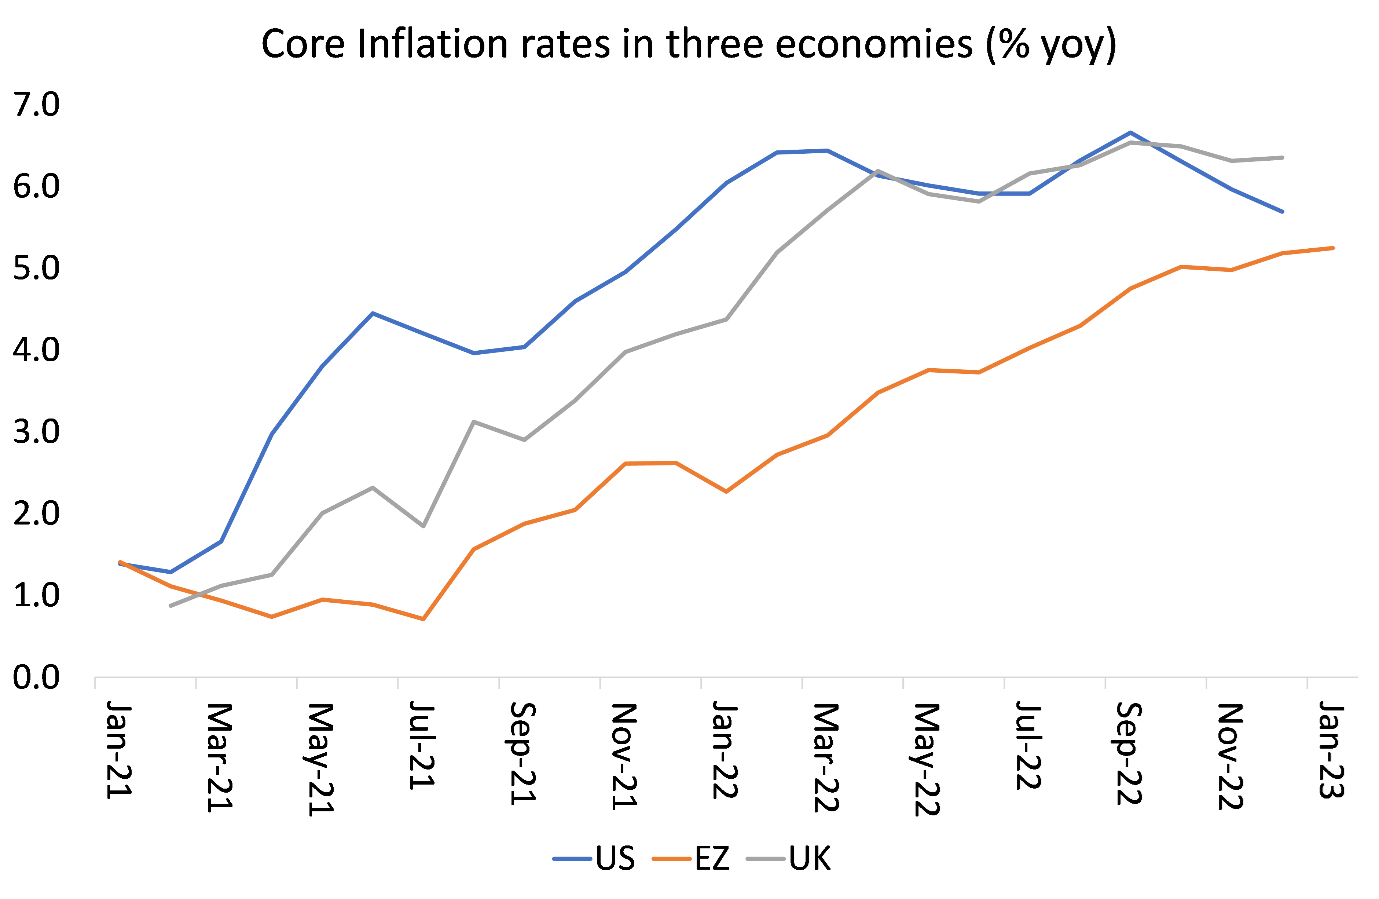
LAST week, US Fed Chair Jay Powell gave testimony to the US Congress on inflation and Fed monetary policy. He spooked financial markets when he appeared to say that the latest data on the economy would probably require further interest-rate hikes and at a faster pace. Powell argued that although the headline inflation rate had fallen back, the ‘core’ inflation rate, which excludes energy and food prices, remained ‘sticky’. Also, the US labour market still seemed exceptionally strong, justifying the need to control the impact of any wage rises. He again suggested that it would be necessary to hike further the Fed’s policy rate (which sets the floor for all other borrowing rates) until wage costs came under control.
Once again, Powell, like other central bank governors, claimed that inflation was being driven by ‘excessive demand’ and also by the risk of rising wages causing a ‘wage-price’ spiral. But there is plenty of evidence that it is not excessive demand or wage-push that has caused the acceleration of inflation. I have offered such evidence in several previous posts. And in a recent post, I recounted a long study by Joseph Stiglitz that offered comprehensive data showing that inflation was caused by supply-side shortages not ‘excessive demand’.
Since then, more evidence has appeared backing up the supply story. One recent paper found that when the economy came out of the COVID pandemic lockdowns and slump there was a shift into buying more goods. However, producers were unable to deal with this surge. “Our main finding is that the shift in consumption demand from services towards goods can explain a large proportion of the rise in U.S. inflation between 2019:Q4 and 2021:Q4. This demand reallocation shock is inflationary due to the costs of increasing production in goods-producing sectors and because such sectors tend to have more flexible prices than those producing services.”
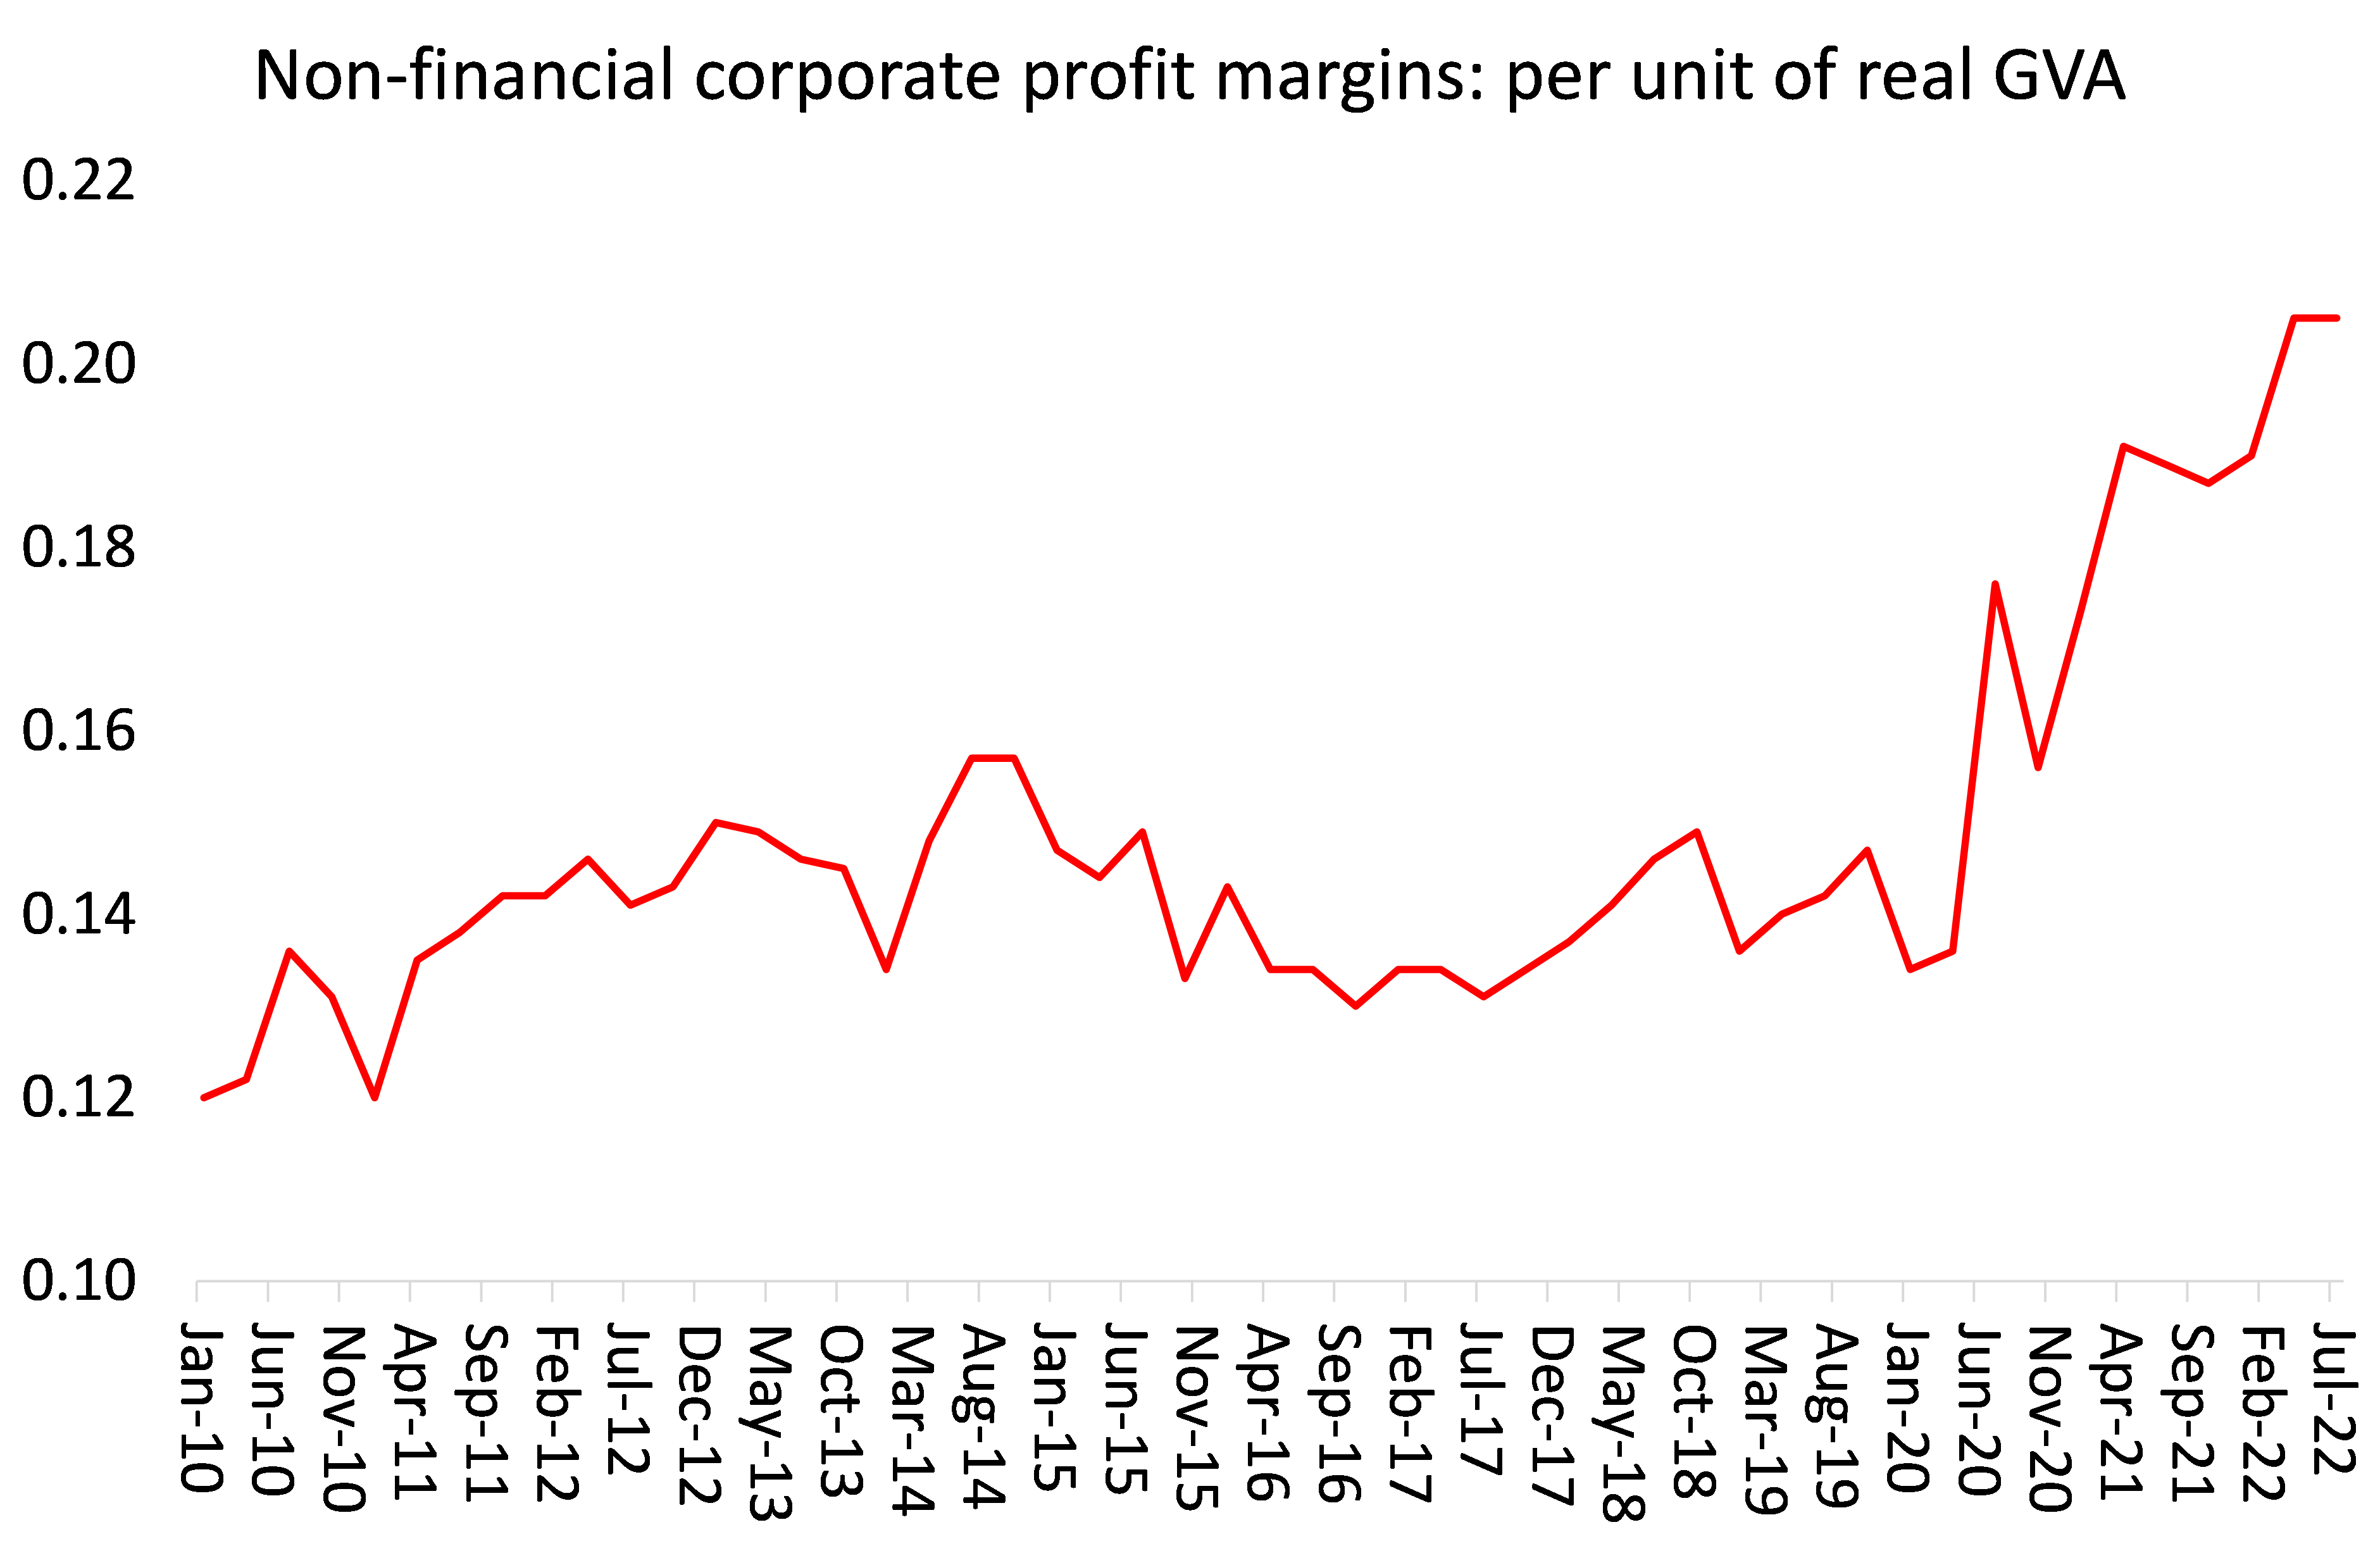
And there is further evidence that the inflationary spike was driven mostly by non-labour costs (raw materials, components and transport) and by sharp rises in profit mark-ups. Wage rises made the least contribution.
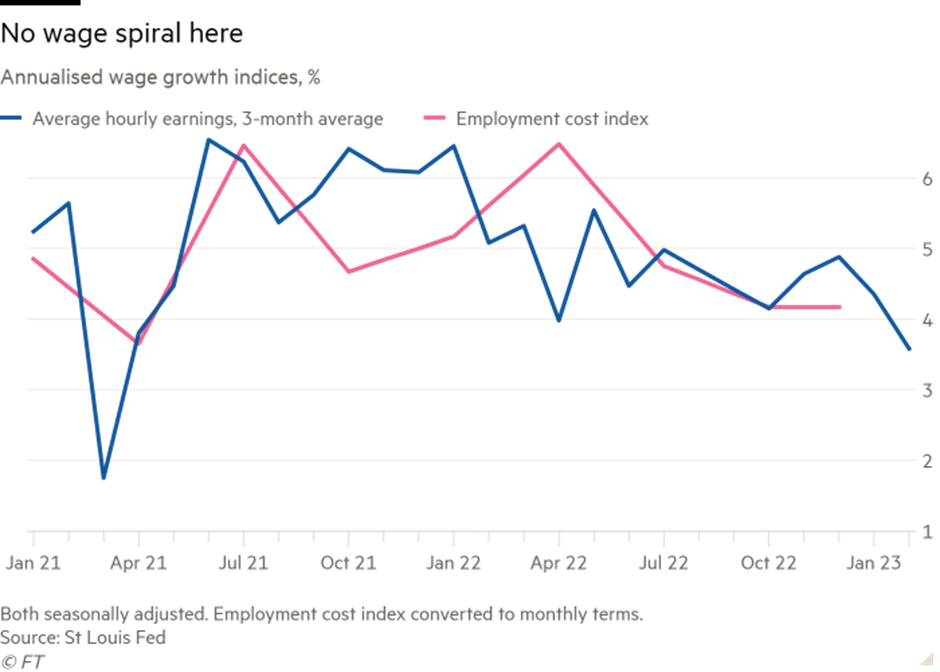
The latest US data on wage increases confirm that there is no ‘wage-push’ inflation.
And this is not just in the US. In the Eurozone, it is even more the case that non-labour costs and profits drove inflation rates. The ECB recently published an estimate of the contributions from profits, taxes and labour costs to EZ inflation.

Well, even so, can it be argued that tighter monetary policy ie raising interest rates to increase the cost of borrowing and reducing money supply by selling central banks’ stock of bonds can still get inflation down? Well, not according to the ECB’s own analysis. In a study, the ECB found that an interest-rate hike by 1 percentage point only reduces inflation by about 0.1 to 0.2 percentage points. The ECB also estimates that the largest negative year-on-year effect of rate hikes on GDP will materialise only after nine quarters!

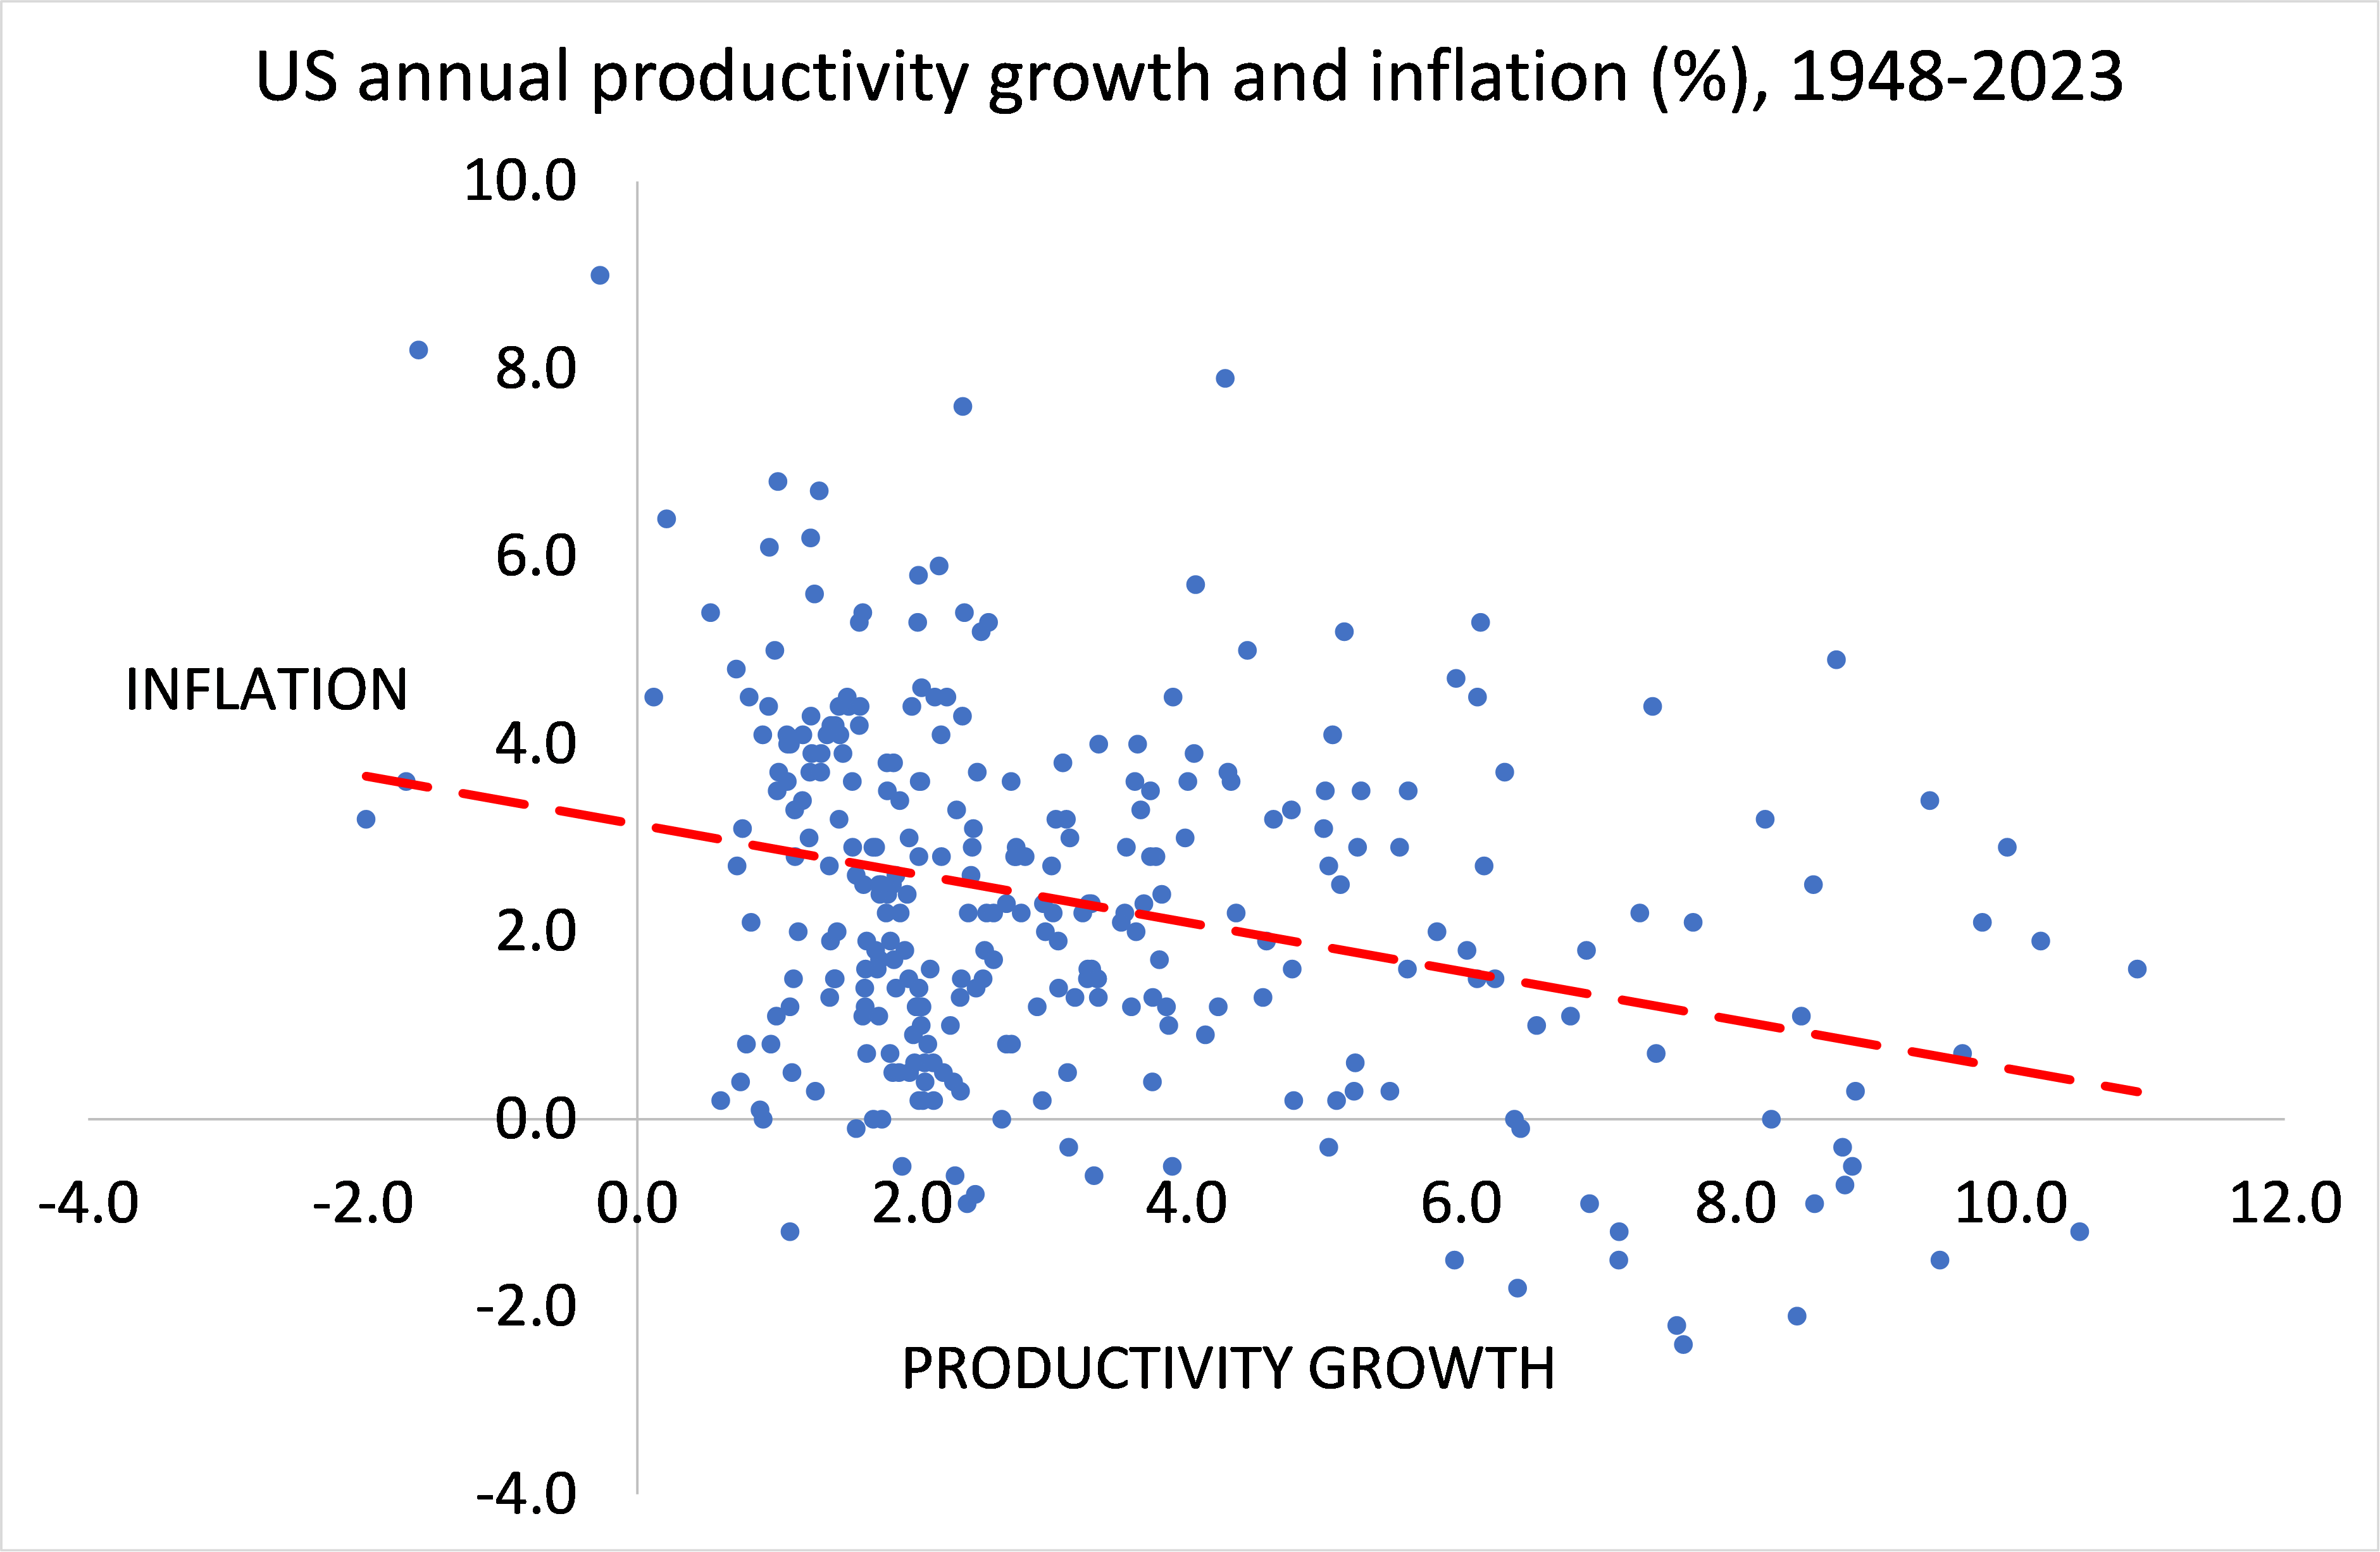
It’s the supply-side that is key to inflation. In particular, over the long term, it is the rate of productivity growth in any economy. If the growth in production per employee slows or even falls, costs per unit of production will rise and that will force companies to try and raise prices. Another recent paper argued that “sector-wide cost shocks and supply bottlenecks” create the conditions for companies with some pricing power to raise prices to protect profit margins. It becomes ‘sellers inflation’.
Productivity growth is key to inflation. Indeed, there is a strong inverse correlation (0.45) between productivity growth and inflation rates over the last two decades.
Powell is now talking of going higher and faster with rates. But the impact of previous hikes have hardly affected inflation. And controlling the money supply does not seem to have much effect on inflation, contrary to the view of the monetarists. The Bank for International Settlement (BIS) is the international association of central banks globally. Its economists are firm monetarists and Austrian school supporters of free markets. In a recent study, the BIS found “a statistically and economically significant correlation across a range of countries between excess money growth in 2020 and average inflation in 2021 and 2020.” John Plender of the Financial Times, another Austrian school pundit, concluded that “you do not have to be an out and out devotee of the quantity theory of money to see that the buoyancy of US house prices and equities last year was substantially about too much money chasing too few assets.”
Note two things here. First, there is causality. As the BIS admits “The debate about the direction of causality in the link between money and inflation has not been fully settled. The observation that money growth today helps to predict inflation tomorrow does not, in and of itself, imply causality.” It could be that “it is income, not money, that causes spending to increase, with the evolution of money balances acting as a signal.” But then the BIS goes onto argue that “causality is neither necessary nor sufficient for money to have useful information content for inflation – which is our focus here.” Really? Surely it matters whether it is economic activity, production and spending growth that drives overall money supply, or vice versa?
Second, Plender notes that increased money supply is associated with rising house prices and stock prices – no mention of the prices of goods and services. And that is the point. Strong money supply growth and low interest rates up to the point of the pandemic did not lead to rising prices and accelerating inflation in the shops. Instead, money supply fuelled a credit boom expressed in a boom in real estate and financial assets.
What is missing from the monetarist argument is that changes in money supply can also mean changes in the velocity of money ie the turnover rate of the existing stock of money. If the velocity of money falls, it means that holders of cash are not spending it on goods and services but hoarding it in deposits or investing in property and financial assets. So as money supply growth accelerated in the first two decades of this century, the velocity of money fell as the cash was used in financial and property speculation.

But note the change since the pandemic. The Fed has been tightening money supply to control inflation. After exploding up in 2020 during the pandemic slump, money supply is now contracting.
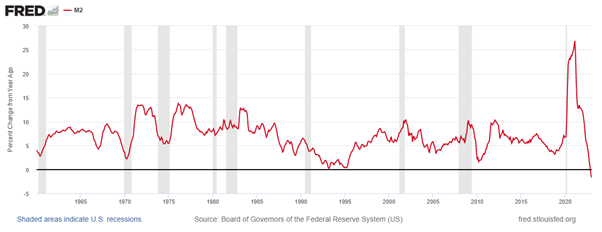
But in contrast, the velocity of that money stock is turning up, counteracting the impact of tighter monetary policy. That makes any tight monetary policy ineffective on inflation, but not necessarily on economic growth and employment. Fed policy will not work except to accelerate any slippage into economic recession. Cleveland Fed researchers analyzed the FOMC’s most recent economic projections. Their model projects the FOMC’s current unemployment forecast would bring core PCE inflation down to 2.75% but only by 2025 And a “deep recession would be necessary to achieve” the 2.1% inflation projection that the Fed is aiming for.
And now we have the collapse of SVB as a result of Fed interest-rate hikes. See my post. Indeed, this may force the Fed to pause on its plan to raise interest rates higher and faster. The Fed is being caught in a dilemma: more rate hikes could mean more bank failures and recession; but stopping hikes means that the Fed is toothless in dealing with inflation.
The worst is to come for the so-called global south. If the Fed continues to hike, then the US dollar will regain strength after the recent brief pause (graph below).

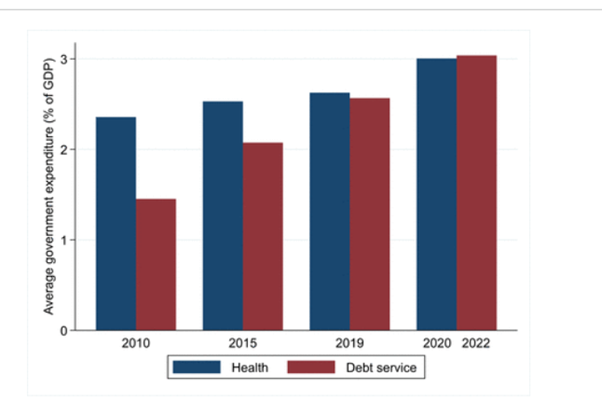
Total global debt is now over $300trn, or 345% of their combined GDP, up from $255trn, or 320% of GDP, before the covid-19 pandemic. The more indebted the world becomes, the more sensitive it is to rate rises. To assess the combined effect of borrowing and higher rates, The Economist , estimated the interest bill for firms, households and governments across 58 countries. Together these economies account for more than 90% of global GDP. In 2021 their interest bill stood at a $10.4trn, or 12% of combined GDP. By 2022 it had reached a whopping $13trn, or 14.5%. As much of the debt owed by economies in the Global South is in dollars, an appreciating dollar relative to their own currencies is an extra burden. Developing economies now spend more on external debt service than on the health of their citizens!
So not only is recession on the agenda in the G7 economies, but debt default and slump is already beginning in ‘developing’ economies (e.g. Sri Lanka, Zambia, Pakistan, Egypt).
Thanks to many generous donors BRAVE NEW EUROPE will be able to continue its work for the rest of 2023 in a reduced form. What we need is a long term solution. So please consider making a monthly recurring donation. It need not be a vast amount as it accumulates in the course of the year. To donate please go HERE.

Be the first to comment