
Since 2016 and global inequality has edged downward slightly. Whereas the top 1% of wealth holders had 50% of the world’s personal wealth in 2016, up from 45% in 2006, that ratio has slipped back to 45%. Today, the share of the bottom 90% accounts for 18% of global wealth, compared to 11% in 2000.
Michael Roberts is an Economist in the City of London and prolific blogger
Cross-posted from Michael Roberts Blog
The annual Credit Suisse report on global wealth has just been released. This report remains the most comprehensive and explanatory analysis of global wealth (not income) and inequality of wealth. Every year the CS global wealth report analyses the household wealth of 5.1 billion people across the globe. Household wealth is made up of the financial assets (stocks, bonds, cash, pension funds) and property (houses etc) owned. And the report measures this net of debt. The report’s authors are James Davies, Rodrigo Lluberas and Anthony Shorrocks. Professor Anthony Shorrocks was my university flatmate, where we both graduated in economics (although he has the much better mathematical skills!).
Global wealth grew during the past year by 2.6% to USD 360 trillion and wealth per adult reached a new record high of USD 70,850, 1.2% above the level of mid-2018 with Switzerland topping the biggest gains in wealth per adult this year. The US, China, and Europe contributed the most towards global wealth growth with USD 3.8 trillion, USD 1.9 trillion and USD 1.1 trillion respectively.
As in every year it has been published, the report reveals the extreme inequality of personal wealth globally. The bottom half of adults in the world accounted for less than 1% of total global wealth in mid-2019, while the richest decile (the top 10% of adults) possessed 82% of global wealth and the top percentile (1%) owned nearly half (45%) of all household assets. Wealth inequality is lower within individual countries: typical values would be 35% for the share of the top 1% and 65% for the share of the top 10%. But these levels are still much higher than the corresponding figures for income inequality, or any other broad-based welfare indicator.
While advances by emerging markets continued to narrow the gaps between countries, inequality within countries grew as economies recovered after the global financial crisis. As a result, the top 1% of wealth holders increased their share of world wealth. But this trend appears to have abated since 2016 and global inequality has edged downward slightly. Whereas the top 1% of wealth holders had 50% of the world’s personal wealth in 2016, up from 45% in 2006, that ratio has slipped back to 45%. Today, the share of the bottom 90% accounts for 18% of global wealth, compared to 11% in 2000.
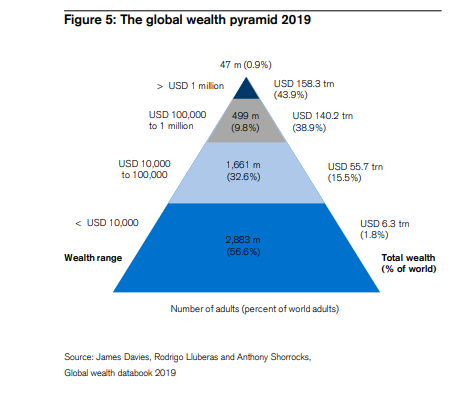
The wealth pyramid captures the wealth differences between adults. Nearly 3bn adults – 57% of all adults in the world – have wealth below USD 10,000 in 2019. The next segment, covering those with wealth in the range USD 10,000–100,000, has seen the biggest rise in numbers this century, trebling in size from 514 million in 2000 to 1.7 billion in mid-2019. This reflects the growing prosperity of emerging economies, especially China. The average wealth of this group is USD 33,530, still less than half the level of average wealth worldwide, but considerably above the average wealth of the countries in which most of the members reside. This leaves the final group of countries with wealth below USD 5,000, which are heavily concentrated in central Africa and central and south Asia.
So here’s the staggering thing. If you live in one of the advanced capitalist countries and you own your house and have some savings, then you will be among the top 10% of all wealth holders in the world. That’s because the vast majority of households in the world have little or no wealth at all.
A person needs net assets of just USD 7,087 to be among the wealthiest half of world citizens in mid-2019! However, USD 109,430 is required to be a member of the top 10% of global wealth holders and USD 936,430 to belong to the top 1%. African and Indian citizens are concentrated in the base segment of the wealth pyramid, China in the middle tiers, and North America and Europe in the top percentile. But also evident is a significant number of North American and European residents in the bottom global wealth decile, as younger adults acquire debt in advanced economies, resulting in negative net wealth.
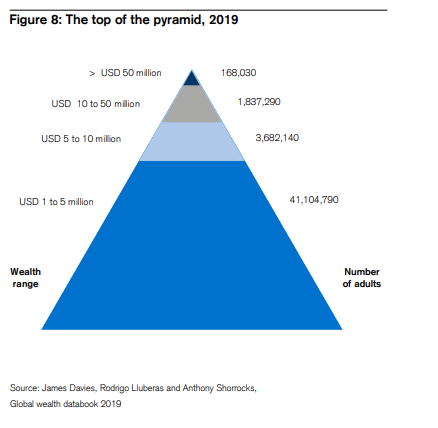
And inequality gets wider at the top of the pyramid. There are 46.8 million millionaires in the world in mid-2019, but most have wealth between USD 1 million and USD 5 million: 41.1 million or 88% of the millionaires. Another 3.7 million adults (7.9%) are worth between USD 5 million and 10 million, and almost exactly two million adults now have wealth above USD 10 million. Of these, 1.8 million have assets in the USD 10–50 million range, leaving 168,030 Ultra High Net Worth (UHNW) individuals with net worth above USD 50 million in mid-2019. In effect, these are the ruling elite of the world.
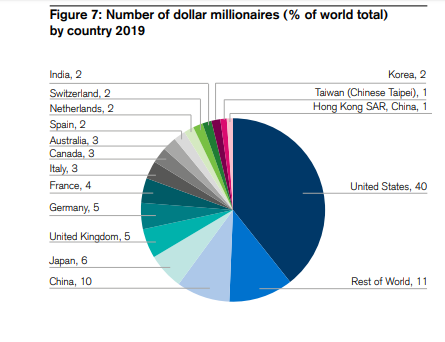
The United States has by far the greatest number of millionaires: 18.6 million, or 40% of the world total. For many years, Japan held second place in the millionaire rankings by a comfortable margin. However, Japan is now in third place with 6%, overtaken by China (10%). Next come the United Kingdom and Germany with 5% each, followed by France (4%), then Italy, Canada and Australia (3%).
Switzerland (USD 530,240), Australia (USD 411,060) and the United States (USD 403,970) again head the league table according to wealth per adult. The ranking by median average wealth per adult favours countries with lower levels of wealth inequality. This year, Australia (USD 191,450) edged ahead of Switzerland (USD 183,340) into first place. So Australia has the highest median wealth per adult in the world (that’s mainly house values).
Financial assets suffered most during the financial crisis of 2008-9 and then recovered in the early post-crisis years. This year, their value rose in every region, contributing 39% of the increase in gross wealth worldwide, and 71% of the rise in North America. However, non-financial assets (property) provided the main stimulus to overall growth in recent years. Over the 12 months to mid-2019, they grew faster than financial assets in every region. Non-financial wealth accounted for the bulk of new wealth in China, Europe and Latin America, and almost all new wealth in Africa and India. But household debt rose even faster, at 4.0% overall. Household debt increased in all regions, and at a double-digit rate in China and India. The debt squeeze is coming.

Be the first to comment