

What is never mentioned with regard to Transparency International’s Corruption Perception Index is that it takes two parties to make a corrupt deal. Transparency only counts the recipient of corruption, not the party paying. If they did that, the whole of their map could become much the same colour. Greece may be dark orange, but especially German companies paid millions in bribes to Greek officials. The question is who corrupts whom?
Cross-posted from Tax Justice Network
On February 22nd, 2018, Transparency International published the latest edition of the Corruption Perception Index, less than a month after the publication of TJN’s Financial Secrecy Index.
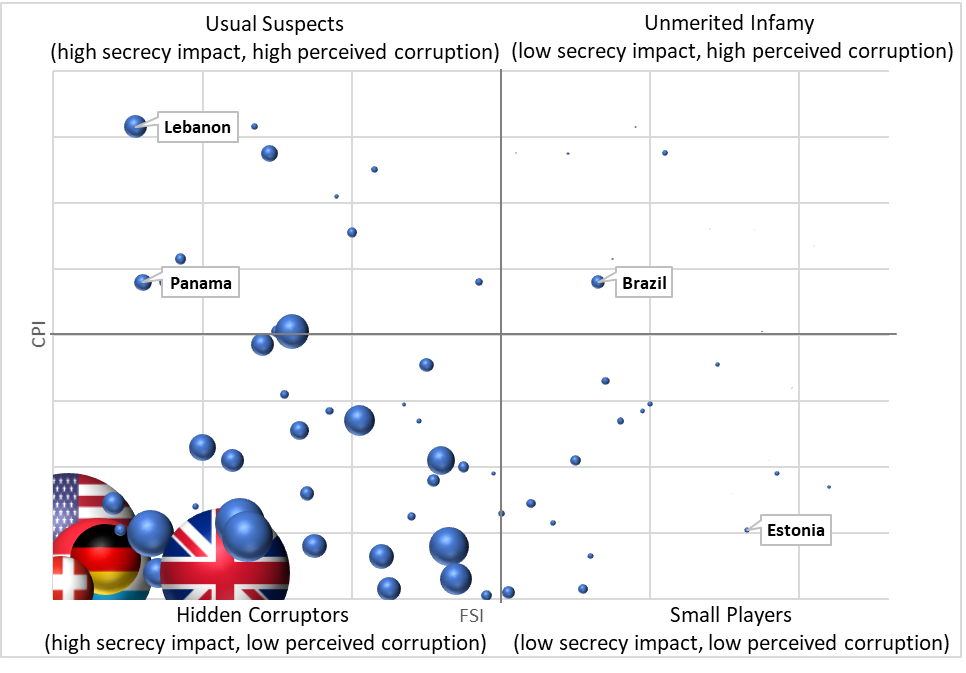
Comparing Transparency International’s Corruption Perception Index (CPI) and TJN’s Financial Secrecy Index (FSI) may be like comparing apples to oranges. Not only do they measure different things, but the way they measure them is completely different: the Corruption Perception Index, as its names indicates, it’s based on people’s perceptions. The FSI in contrast, considers objectively verifiable criteria, such as a country’s actual laws or whether a country signed relevant multilateral conventions or whether they comply with international standards (e.g. anti-money laundering).
Nevertheless, visually, both indexes reveal an interesting story.
The Corruption Perception Index suggests that Africa, Latin America and Asia are perceived as the most corrupt (dark red), by the international and country experts who participate in the surveys that are aggregated in the CPI. If local corruption in those countries were actually as bad as this small group of people perceive it to be, it would raise the question: who is enabling that corruption? Who benefits? Where might the crimes and the proceeds be hidden? The Financial Secrecy Index answers that question: countries in Europe and North America, where local corruption is perceived to be low, are objectively the worst offenders in enabling global corruption and illicit financial flows.
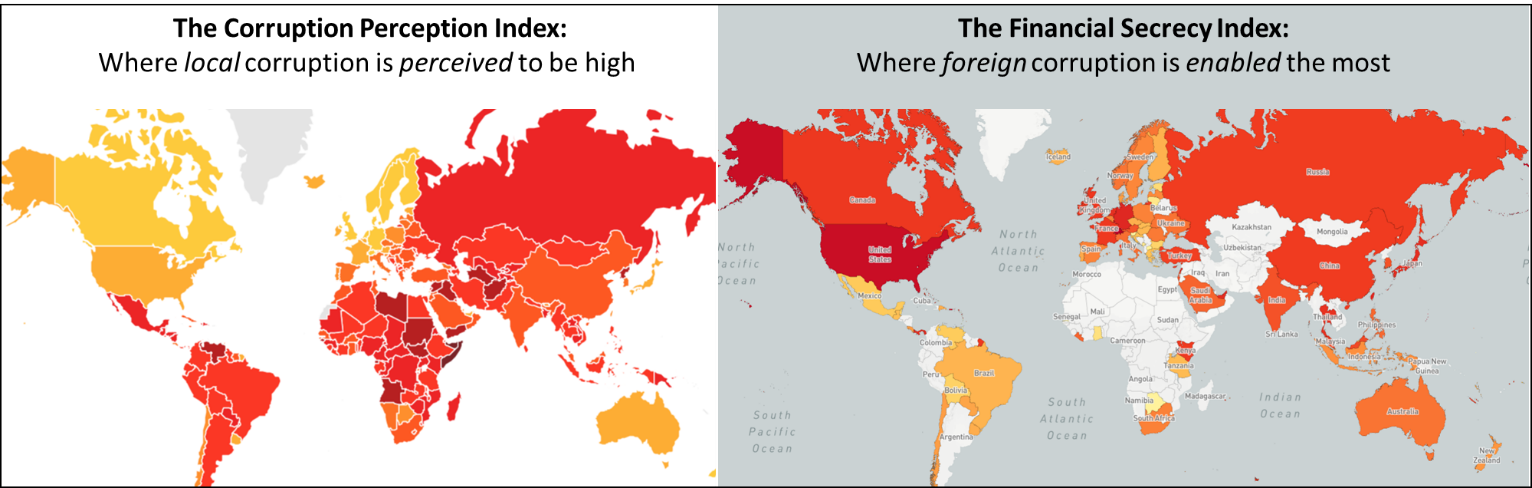 Source: Author’s elaboration based on Transparency International’s map and 23degrees’s map of TJN’s Financial Secrecy Index

Be the first to comment