
The rise of China has led to inequality falling on the global scale over the past 20 years, but that’s highly unlikely to continue.
Michael Roberts is an Economist in the City of London and a prolific blogger
Cross-posted from Michael Roberts’ blog
Branco Milanovic, former chief economist at the World Bank, has become the leading analyst on global inequality. Starting with his book, Worlds Apart in 2005, he has documented trends in the global inequality of income (not so much wealth) since the industrial revolution and since capitalism becoming the dominant mode of production globally.
In that book, he calculated that the global inequality of income (and wealth), was ’20:80′ (i.e. that 80% of world’s then 6.6bn population could be classed as poor) and the situation was getting worse, not better, even if you take into account the then booming so-called BRICs (Brazil, Russia, India and China).
At that time he presented the changes in real income for people globally at various percentiles of income distribution and produced what became called the ‘elephant graph’ – namely that the big improvements in income levels were to be found in the middle range of incomes, while the very poor and those in upper income ranges (except for the extremely rich) actually lost ground.
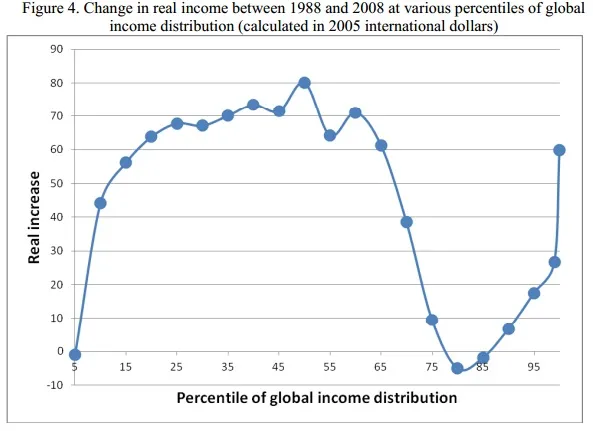
That suggested to many that global inequality was falling because middle income earners around the world had gained. There was a great convergence, not divergence.
But the elephant graph hid the reality. This prospering middle-income group was almost entirely due to China. The Chinese economy has taken upwards of 900m Chinese out of dire poverty in just three decades and average incomes rocketed, particularly in the last two decades. If you strip out China, the elephant graph collapses. Neither the rest of Asia nor India have managed any such improvement in average incomes. There were also many other reasons to be sceptical of the elephant graph and the conclusions that you can draw from it – read my posts on this here.
But now Milanovic has updated his estimates of global inequality in a new study. Some journalists have headed the results as “The world is the most equal it has been in over a century.” Sounds great – but again, the devil is in the detail.
There are two factors in global inequality: inequality between national per capita incomes and inequality of income of people within nations. In previous work, Milanovic argued the the former is more important in overall global inequality for individuals than the latter. So where you live is more important than your income in that country compared to the richest there.
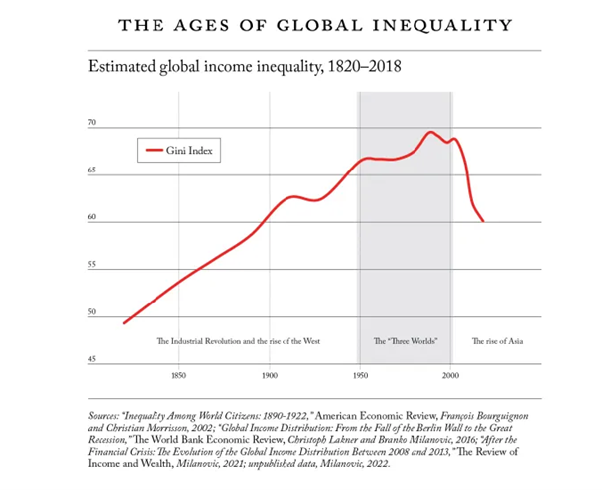
In his latest work, Milanovic re-estimates global inequality between 1820 and 1980, reappraises the results up to 2013, and presents new inequality estimates for 2018. He concludes that, historically, global inequality has followed three eras: the first, from 1820 until 1950, characterized by rising between country income differences and increasing within-country inequalities; the second, from 1950 to the last decade of the 20th century, with very high global and between-country inequality; and the current one of decreasing inequality thanks to the rise of Asian incomes, especially Chinese.
According to Milanovic, from the advent of the Industrial Revolution in the early nineteenth century to about the middle of the twentieth century, global inequality rose as wealth became concentrated in Western industrialized countries. It peaked during the Cold War, when the globe was commonly divided into the “First World,” the “Second World,” and the “Third World,” denoting three levels of economic development. But then, around 20 years ago, global inequality began to fall, largely thanks to the economic rise of China, which until recently was the world’s most populous country. Global inequality reached its height on the Gini index of 69.4 in 1988. It dropped to 60.1 in 2018, a level not seen since the end of the nineteenth century.
The first era of global inequality stretched from roughly 1820 to 1950, a period characterized by the steady rise of inequality. Around the time of the Industrial Revolution (approximately 1820), global inequality was rather modest. The GDP of the richest country (the United Kingdom) was five times greater than that of the poorest country (Nepal) in1820. (The equivalent ratio between the GDPs of the richest and poorest countries today is more than 100 to 1.)
The growth of global inequality during the nineteenth century and the first half of the twentieth century was driven both by widening gaps between various countries (measured by the differences in their per capita GDPs) and by greater inequalities within countries (measured by the differences in citizens’ incomes in a given country). The country-to-country differences reflected what economic historians have called the Great Divergence, the growing disparity between, on the one hand, the industrializing countries of western Europe, North America, and, later, Japan, and, on the other hand, China, India, the African subcontinent, the Middle East, and Latin America, where per capita incomes stagnated or even declined. In effect, this was a quantitative measure of the domination of a small bloc of imperialist countries over the rest.
But Milanovic finds that global inequality began to dip about two decades ago. It has dropped from 70 Gini points around the year 2000 to 60 Gini points two decades later. This decrease in global inequality, having occurred over the short span of 20 years, is more precipitous than was the increase in global inequality during the nineteenth century.
Does this mean that capitalism is succeeding in reducing inequality and there is now a great convergence? No, because the decrease is driven by really just one country’s income growth: China. And at the same time as China’s fast growth reduced the overall global inequality index; within economies, inequality has risen in just about all the major economies.
Moreover, the richest income earners in the world remain living in the imperialist bloc. In 1988, 207 million people made up the top five percent of earners in the world; in 2018, that number was 330 million, reflecting both the increase in the world population and the broadening of available data. Americans make up the plurality of this group. In both 1988 and 2018, over 40 percent of the globally affluent were U.S. citizens. British, Japanese, and German citizens come next. Overall, Westerners (including Japan) account for almost 80 percent of the group. Urban Chinese broke into the globally affluent only more recently. But their share is still small, up from 1.6 percent in 2008 to 5.0 percent in 2018.
Once you exclude China from the data, then there has been no global convergence at all. With China having vacated many of the slots at the bottom of the distribution, those are now filled mostly by poorer Indian households who now have lower living standards than their Chinese counterparts.
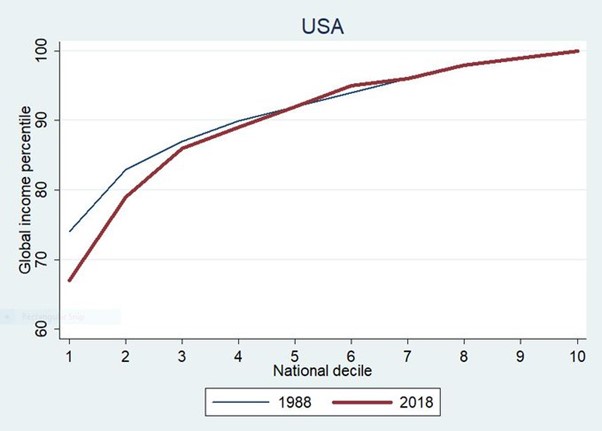
And in the imperialist bloc, the lower income groups have lost ground globally. The poorest Italian families were in the top 30 per cent of the world’s income distribution in 1988, but now only just make it into the top half. Importantly, the middle classes in all rich countries have now slipped down the global rankings. This is a positional reshuffling of major proportions; note the rise in position for lower income earners in China from 1988 to 2018 and the decline in the global position of the lower deciles in Italy and Germany, and even in Poland where Poland’s top 10% also went up significantly.
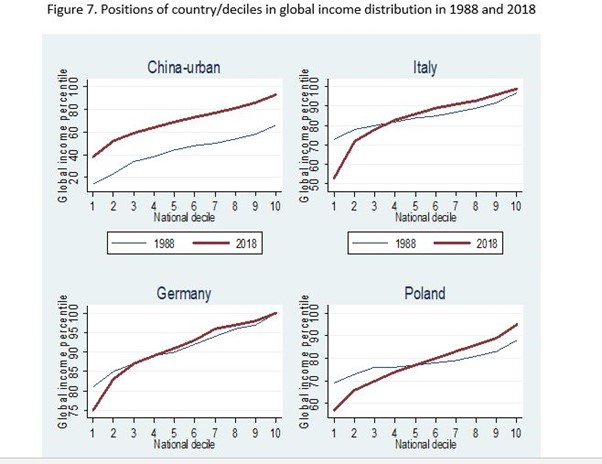
The decline affected the US as well, where about 30-40 percent of the distribution is now placed globally lower than in 1988. Of course, the US richest are still at the global top.
Global inequality will probably not decline any more from here. That’s because China’s phenomenal growth may have closed the income gap with the imperialist countries a little but it is still a long way behind.
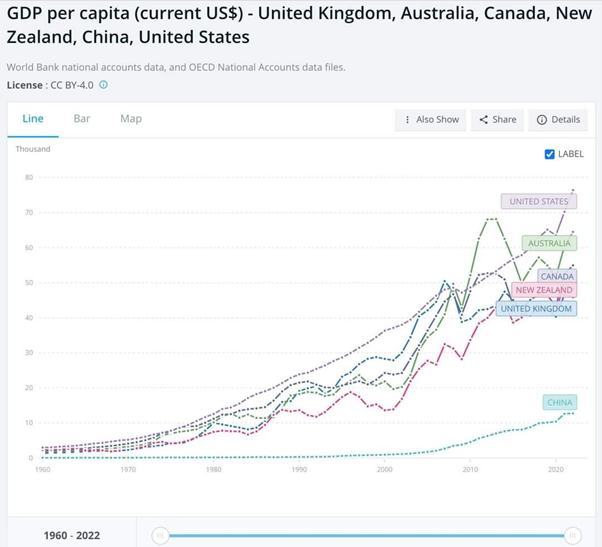
And the income gap between China and most other poorer countries has widened because the latter are making little or no progress in reducing the gap with the imperialist bloc. As Milanovic puts it: “Once we take China out of the picture, the next engine of global inequality reduction is India, but India’s growth started sputtering even before the global financial crisis.”
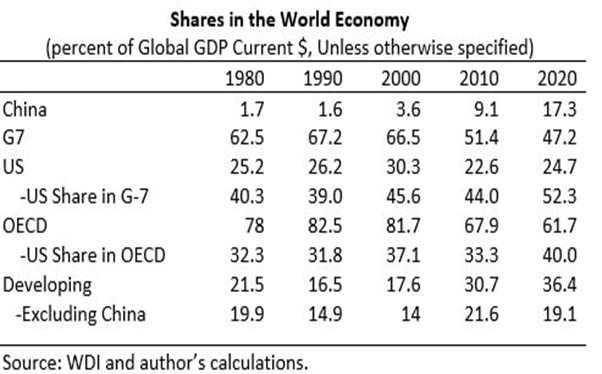
Moreover, the fastest population growth in the world is in Africa. So if global inequality is to fall based on reducing the gap between rich and poor countries, then Africa must start to grow its per capita income at 6-7% a year. Africa has no chance of achieving such growth – on the contrary, its share of global GDP is the same as in 1980 and has lost ground in the 2010s.
If anything, the great divergence is likely to resume.
Thanks to many generous donors BRAVE NEW EUROPE will be able to continue its work for the rest of 2023 in a reduced form. What we need is a long term solution. So please consider making a monthly recurring donation. It need not be a vast amount as it accumulates in the course of the year. To donate please go HERE.

Be the first to comment