
Just as the imperialist bloc rules over trade, GDP, finance and technology, it has nearly all the personal wealth.
Michael Roberts is an Economist in the City of London and a prolific blogger
Cross-posted from Michael Roberts’ blog

Every year, I bring to the attention of readers of my blog, the results of the latest Credit Suisse Wealth Report. It is produced by economists Anthony Shorrocks (with whom I graduated at university), James Davies and Rodrigo Lluberas. It is the most comprehensive study of global personal wealth and inequality between adults around the world.
Personal wealth is defined as ownership of real estate and financial assets (stocks, bonds and cash) less debt for all the adults in the world. According to the 2022 report, by the end of 2021, global wealth reached $463.6 trillion, which is an increase of 9.8% versus 2020 and far above the average annual +6.6% recorded since the beginning of the century. Setting aside exchange rate movements, aggregate global wealth grew by 12.7%, making it the fastest annual rate ever recorded. Average wealth per adult rose to $87,489 at the end of 2021. On a country-by-country basis, the United States added the most household wealth in 2021, followed by China, Canada, India and Australia.

This increase in wealth (real estate and financial assets) was not shared equally. On the contrary, the wealth share of the global top 1% rose for a second year running to reach 45.6% in 2021, up from 43.9% in 2019. This is represented in the report by a pyramid.
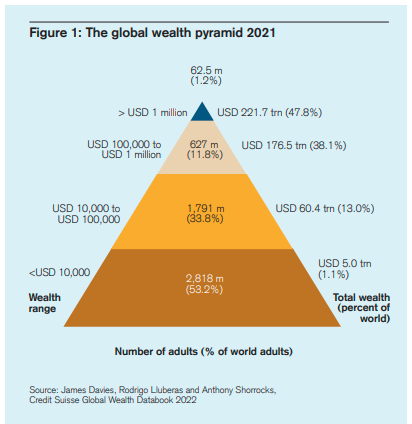
The wealth pyramid shows that 62 million people out of a total of 4.4 billion adults in the world, or just 1.2%, had 47.8% of the world’s wealth while 2.8 billion adults (or 53.2%) had just 1.1% – a staggering level of inequality. While the top 1.2% had average wealth after debt of well over $1 million each, the bottom 53% had well below $10,000 each, at least 100 times less.
And within the wealthiest group, the inequality is equally stark – with yet another pyramid. There are 264,200 ultra-high-networth (UHNW) individuals with net worth above $50 million at the end of 2021. This is 46,000 more than the 218,200 recorded at the end of 2020, which in turn was 43,400 higher than in 2019. These increases are more than double the increases recorded in any other year this century. Taken together, it means that the number of adults with wealth above $50 million expanded by more than 50% in the two years 2020 and 2021. This recent rise in inequality is due to the surge in the value of financial assets during and after the COVID-19 pandemic – and it’s the rich that own most of the financial assets.

The overall increase in global wealth mainly reflects the rise in wealth in China and in the expansion of the ‘middle class’ in the so-called developing world. Even so, this group’s average wealth is $33,724, or only about 40% of the level of average wealth worldwide. The majority of rich and very rich people still live in the so-called ‘Global North’. But note that 7% of the very poorest people in the world live in North America.

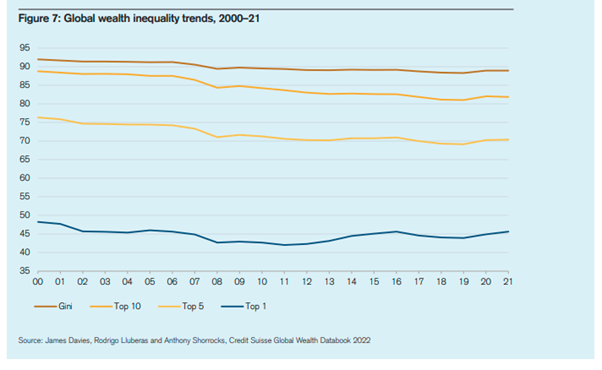
Global inequality rises or falls in response to changes in wealth inequality within countries: the so-called “within-country” component. But it is also affected by changes in the average wealth levels in countries relative to the global average: the “between-country” component. This century, the rise of household wealth in emerging markets, most notably China and India, has narrowed wealth differences between countries, so that the between-country component has declined quite rapidly. This has been the dominant factor governing the overall downward inequality trend.
In the 21st century, median wealth per person has risen from $1613 in 2000 to $8296 in 2021, an annual rise of 8.1%. But this is the result of the sharp rise in median wealth in China from $3133 per person to $26752 in 2021 (12% a year), or from 7% of North America’s median wealth in 2000 to 28% in 2021. China’s median wealth per person in 2000 was about twice the world average; now it is more than three times.
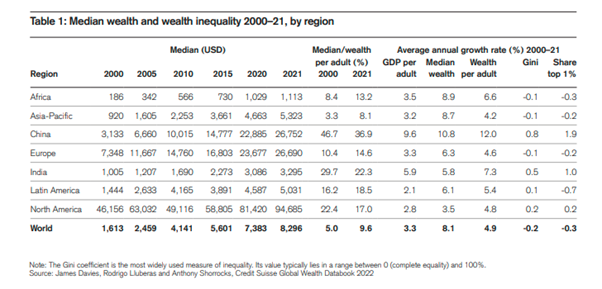
India too saw a rise in median wealth per adult from $1005 in 2000 to $3295 in 2021, 7% a year, but in 2000, India’s wealth per adult was just 2% of that in North America; now it is just 3%; and India’s adults remain well below the world average. Indeed, that ratio fell from 62% in 2000 to 40% now. India is going backwards relatively, while China is going forwards relatively.
And here is a key point worth considering. If you own a property to live in and, after taking out any mortgage debt, you still have over $100,000 in equity and any savings, you are among the wealthiest 10% of all adults in the world. You may find that difficult to believe, but it’s true because most adults in the world have no wealth to speak of at all.
As for inequality between men and women, the report finds that of the 26 countries that make up 59% of the global adult population, 15 countries (including China, Germany and India, for example) show a decline in the wealth of women over the last two years.
As for the super rich worldwide, there were 62.5 million millionaires at the end of 2021, up 5.2 million from a year earlier. The United States added 2.5 million new millionaires, almost half of the global total. This is the largest increase in millionaire numbers recorded for any country in any year this century and reinforces the rapid rise in millionaire numbers seen in the United States since 2016. The US now has 39% of all millionaires in a population of 350m, while China has 10% with a population of 1.4bn.

As for wealth inequality within countries, at year-end 2021, the Gini coefficient (the usual measure of inequality) for wealth was a huge 85.0 in the United States (remember 100 would mean one adult owning all the wealth). Indeed, in the United States, all measures of inequality have trended upward since the early 2000s. For instance, the wealth share of the top 1% of adults rose from 32.9% in 2000 to 35.1% in 2021 in the United States.
What about China? Well, the wealth Gini coefficient rose from 59.5 in 2000 to peak at 71.7 in 2016. Then it eased back to 70.1 by 2021, close to where it was in 2010 and some 20% lower than in the US. Wealth inequality in India was much higher in 2000 and has risen since. The Gini coefficient rose from 74.6 in 2000 to 82.3 at the end of 2021. The wealth share of the top 1% went up from 33.2% in 2000 to 40.6% in 2021. Like the US, India is for the very rich.
In some advanced capitalist economies, wealth inequality fell in the first decade of the 21st century but then rose after the global financial crisis and the pandemic slump. By 2021, the wealth Gini had risen slightly above its 2000 level, standing at 70.2 in France and 70.6 in Britain – about the same as China.
The report provides an overall perspective on the disparity of wealth across countries and regions in its world wealth map. That shows that nations with high wealth per adult (above USD 100,000) are concentrated in North America and Western Europe, and among the richer parts of East Asia, the Pacific and the Middle East, with a sprinkling of outposts in the Caribbean.
China and Russia are core members of the “intermediate wealth” group of countries with mean wealth in the range of USD 25,000–100,000. This group also includes more recent members of the European Union and important emerging-market economies in Latin America and the Middle East.
One step below, the “frontier wealth” range of USD 5,000–25,000 per adult is a heterogeneous group that covers heavily populated countries such as India, Indonesia and the Philippines, plus most of South America and leading sub-Saharan nations such as South Africa. Fast-developing Asian countries like Cambodia, Laos and Vietnam also fall within this category.
Countries with average wealth below USD 5,000 comprise the final group, which is dominated by countries in central Africa.

The imperialist bloc is North America, Europe and Japan with add-ons from Australia. Just as the imperialist bloc rules over trade, GDP, finance and technology, it has nearly all the personal wealth.
Addendum:
My last post was on the Global Wealth report produced every year by Credit Suisse and associated economists. It showed that in 2021, 1.2% of adults had 47.8% of the world’s wealth while 53.2% had just 1.1%.
However, as I published that post, the 2023 global wealth report was released, now under the name of UBS which has taken over Credit Suisse (that’s another story). Now the data show that in 2022, global wealth inequality dropped back to 1% of adults (59m) owning 44.5% of all personal wealth, still slightly higher than before the pandemic in 2019. At the other end of the wealth pyramid, the bottom 52.5% of the world’ population (2.8bn) had net wealth of just 1.2%, slightly better than in 2021.

2022 recorded the first fall in net global household wealth since the global financial crisis of 2008. One reason was an appreciation of the US dollar against other currencies, reducing the dollar wealth of non-dollar countries. Indeed, if exchange rates are held constant at 2021 rates, then total wealth increased by 3.4% and wealth per adult by 2.2% during 2022.
The other reason was the relative decline in financial wealth during 2022 as stock and bond markets prices fell. So the number of US dollar millionaires worldwide fell by 3.5 million during 2022 to total 59.4 million at year-end. The ultra-high net-worth (UHNW) group with wealth above USD 50 million had 22,490 fewer members than in 2021, with North America accounting for 81% of this decline.
But the long-term trends outlined in the post on the 2022 report remain. The vast majority of rich and very rich people still live in the so-called ‘Global North’. This century, the rise of household wealth in emerging markets, most notably in the large populations of China and India, has narrowed wealth differences between countries. And this has been the dominant factor governing the overall slightly downward global inequality trend.

China’s median wealth per person in 2000 was about twice the world average; now it is more than three times. Moreover, it is now higher than the average for the whole of Europe (that’s Western and Eastern Europe)!
And this point remains: If you own a property to live in and, after taking out any mortgage debt, you still have over $100,000 in equity and any savings, you are among the wealthiest 10% of all adults in the world. You may find that difficult to believe, but it’s true because most adults in the world have no wealth to speak of at all.
And apart from phenomenal rise of China, personal wealth and power remains in the imperialist bloc of North America, Europe and Japan with add-ons from Australia. Just as the imperialist bloc rules over trade, GDP, finance and technology, it has nearly all the personal wealth.

Be the first to comment