
In the US we are seeing the dysfunctionality of capitalism is having drastic effect upon life expectancy.
Michael Roberts is an Economist in the City of London and a prolific blogger
Cross-posted from Michael’s Blog

Source: Wikipedia
Life expectancy is one of the best measures of human development. In hunter-gather societies, on average, about 57-67% of children made it to 15 years. Then 79% of those 15 year-olds made it to 45 years. Finally, those remaining at 45 years could expect to reach around 65-70 years. So we can see that life expectancy at birth in these societies was very low, given high child mortality. But some 40% did make it to about 65 years on average. It seems to have been worse in the class-based feudal and slave societies. The average medieval life expectancy for a peasant was only a mere 35 years of age at birth, but it was closer to 50 years on average for those who made it beyond 15 years.
You can see that measuring life expectancy at birth is not a perfect guide to how long humans did live in pre-capitalist societies. Nevertheless, there is no doubt that life expectancy on average rose sharply once science came to bear on hygiene, sewage, knowledge of the human body, better nutrition etc. Of course, there were sharp inequalities in life expectancy in class societies between rich and poor.
If we accept that life expectancy is a good measure of human development, the latest data are revealing about capitalist societies in the 21st century. Life expectancy fell in the US in 2021 to its lowest since 1996, the second year of a historic retreat, mainly due to COVID-19 deaths. The decline from 2019 marked the largest two-year drop in life expectancy at birth in close to a century, the US Centers for Disease Control and Prevention (CDC) found. Also, disparity in life expectancy between men and women widened last year to the highest in more than two decades, with American men now expected to live just 73.2 years, nearly six fewer years than women.
Deaths from COVID-19 contributed to over half of the overall decline in US life expectancy last year. COVID-19 was associated with more than 460,000 U.S. deaths in 2021, according to the CDC. But COVID was not the only factor in the decline. Drug overdoses and heart disease are also major contributors, the data showed. Interestingly, deaths from suicide decreased in 2020 during COVID, but they were still the fifth-biggest contributor to the drop in overall life expectancy last year. Suicide-related deaths are the third-leading contributor to the decline in life expectancy for American men.
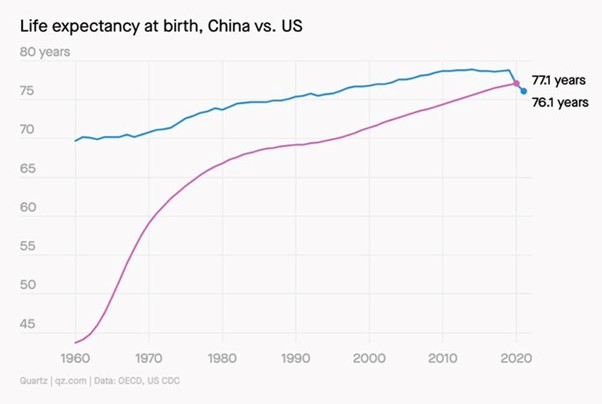
While US life expectancy decreased from 78.6 years in 2019 to 76.9 years in 2020 and 76.1 years in 2021, a net loss of 2.4 years, in contrast, peer countries averaged a smaller decrease in life expectancy between 2019 and 2020 (0.55 years) and a 0.26-year increase between 2020 and 2021, widening the gap in life expectancy between the US and other advanced capitalist economies to more than five years. The decrease in US life expectancy was highly racialised: as the largest decreases in 2020 occurred among American Indian/Alaska natives, hispanics, black and Asian populations. For native Americans and Alaska natives, life expectancy fell to 65, close to the national average during World War II.
This decline in life expectancy in rich US contrasts with the continued rise in China throughout the COVID pandemic – where the death rate from the virus was minimal compared to the US and Europe. As a result, in 2021, China’s life expectancy at birth is now higher than that of the US!
This outcome is a stark and depressing condemnation of American capitalism in the 21st century. “The stagnation in life expectancy reflects deep societal challenges — not just in our health system but also in our economic and political systems,” said Dave Chokshi, a physician and former NYC health commissioner.
It was not just the pandemic. Americans of every age, at every income level, are unusually likely to die, from guns, drugs, cars, and disease. American babies are more likely to die before they turn five; American teens are more likely to die before they turn 20; and American adults are more likely to die before they turn 65. Europe has better life outcomes than the US across the board, for white and black people, in high-poverty areas and low-poverty areas.
The US has more drug-overdose deaths than any other high-income country—both overall and on a per capita basis. Even before the pandemic, life expectancy in the U.S. declined for consecutive years in 2015 and 2016, largely because of the opioid epidemic and drug overdoses. The U.S. has a higher death rate from road accidents than Canada, Australia, Japan, South Korea, and the European Union. Even on a per-miles-driven basis, the US still has a higher death rate than much of Europe.
At 40 percent among adults, the US obesity rate is double the average of most European countries and eight times higher than Korea’s or Japan’s. Although the precise relationship between weight and health is contentious, the nonpartisan Commonwealth Fund has stated bluntly that America’s obesity levels are responsible for roughly one-fifth of deaths among American adults aged 40 to 85.
The U.S. has fewer general practitioners per capita than most rich countries, in part because of the long and expensive medical education encourages doctors to become highly paid specialists. And along with this lack of affordable and accessible primary care, the US has the highest rate of avoidable deaths of any rich nation. (Examples of the OECD’s definition of “avoidable” mortality include deaths related to alcohol, shootings, accidents, and influenza.)
Life expectancy is an important measure of human development but it is not the only measure. The UN has created a human development index (HDI) which measures not just life expectancy but also educational advancement and economic prosperity. The HDI was launched in 1990. In its latest Human Development Report (HDR) the data confirm that capitalism in the 21st century, if it ever was, is no longer progressive in the development of human well-being. The report says that “decades of progress in terms of life expectancy, education and economic prosperity have begun unravelling since the pandemic.” Over the past two years, nine out of ten countries have slid backwards on their HDI.
Switzerland sits at the top of the index with a life expectancy of 84 years, an average of 16.5 years spent in education and median salary of $66,000. At the other end of the scale is South Sudan where life expectancy is 55, people spend just 5.5 years in school on average and earn $768 a year. But recent setbacks in a majority of the 191 countries included in the index, especially in life expectancy, have taken development levels back to those seen in 2016, reversing a 30-year trend.

Over the years since the index was introduced, many countries have faced crises and slid backwards, but the global trend consistently moved upwards. Last year was the first time the index declined overall since calculations began and this year’s results solidified that downward trend. And “the outlook for 2022 is grim,” says Achim Steiner, one of the HDR authors, who points out that more than 80 countries are facing problems paying off their national debt. “Eighty countries being one step away from facing that kind of crisis is a very serious prospect,” he says. “We are seeing deep disruptions, the tail end of which will play out over a number of years.”
When we look at the league table of countries in the HDI, the usual richer advanced capitalist economies are at the top. But the US is not in the top 20; it’s 21st, although it has by far the largest in population of these richer countries. And if we compare the progress in human development in the top G7 economies using the HDI since 1990, we find, whereas the US was the highest of the G7 in 1990, it has slipped to fifth out of seven. While Germany’s HDI rose 13.6% from 1990-2021, the US HDI rose only 5.6%. And the US rose the least of the G7 in the 21st century. Strangely, the UK rose the most from 1990, if from a lower start, and was the fastest riser in the 21st century to date. This may be due to the higher than average spending on education in the 1990s and early 2000s.
| 1990 | 2000 | 2021 | 1990-2021 | 2000-21 | |
| Ger | 0.829 | 0.889 | 0.942 | 13.6 | 6.0 |
| Can | 0.860 | 0.890 | 0.936 | 8.8 | 5.2 |
| UK | 0.804 | 0.862 | 0.929 | 15.5 | 7.8 |
| Jap | 0.845 | 0.877 | 0.925 | 9.5 | 5.5 |
| US | 0.872 | 0.891 | 0.921 | 5.6 | 3.4 |
| Fra | 0.791 | 0.844 | 0.903 | 14.2 | 7.0 |
| Ita | 0.778 | 0.841 | 0.895 | 15.0 | 6.4 |
Every G7 country did better than the US – another indicator of the relative decline of US imperialism.
The UN has also developed an inequality-adjusted HDI, where the degree of inequality of income is fed into the HDI to change the outcome. Every country has a degree of inequality. But some are much worse than others. Among the G7 economies, the level of inequality in the US and Italy is so high that it reduces the HDI in those two countries by over 11% and knocks them even further down the HDI league.

This is not surprising given the huge rise in inequality and poverty in the US since the HDI was started. In January 2022, the U.S. Census Bureau reported that in 2020, there were 37.2 million people in poverty, approximately 3.3 million more than in 2019 – that’s an official poverty rate of 11.4 percent, up 1.0 percentage point from 10.5 percent in 2019. The “poverty threshold” for a four-person family in 2020 was $26,496. And the US Federal Reserve reports that in 1989 the top 1 percent controlled 23.5 percent of the nation’s wealth and, in 2022, its share had increased to 31.8 percent or $44.9 trillion. The bottom 50% of wealth holders had 3.7% of household wealth in 1989; now they have 2.8%.

Inequality is even higher in many Global South countries, in particular, Brazil, South Africa and India have shocking inequality rates that knocks their HDIs by over 25%.

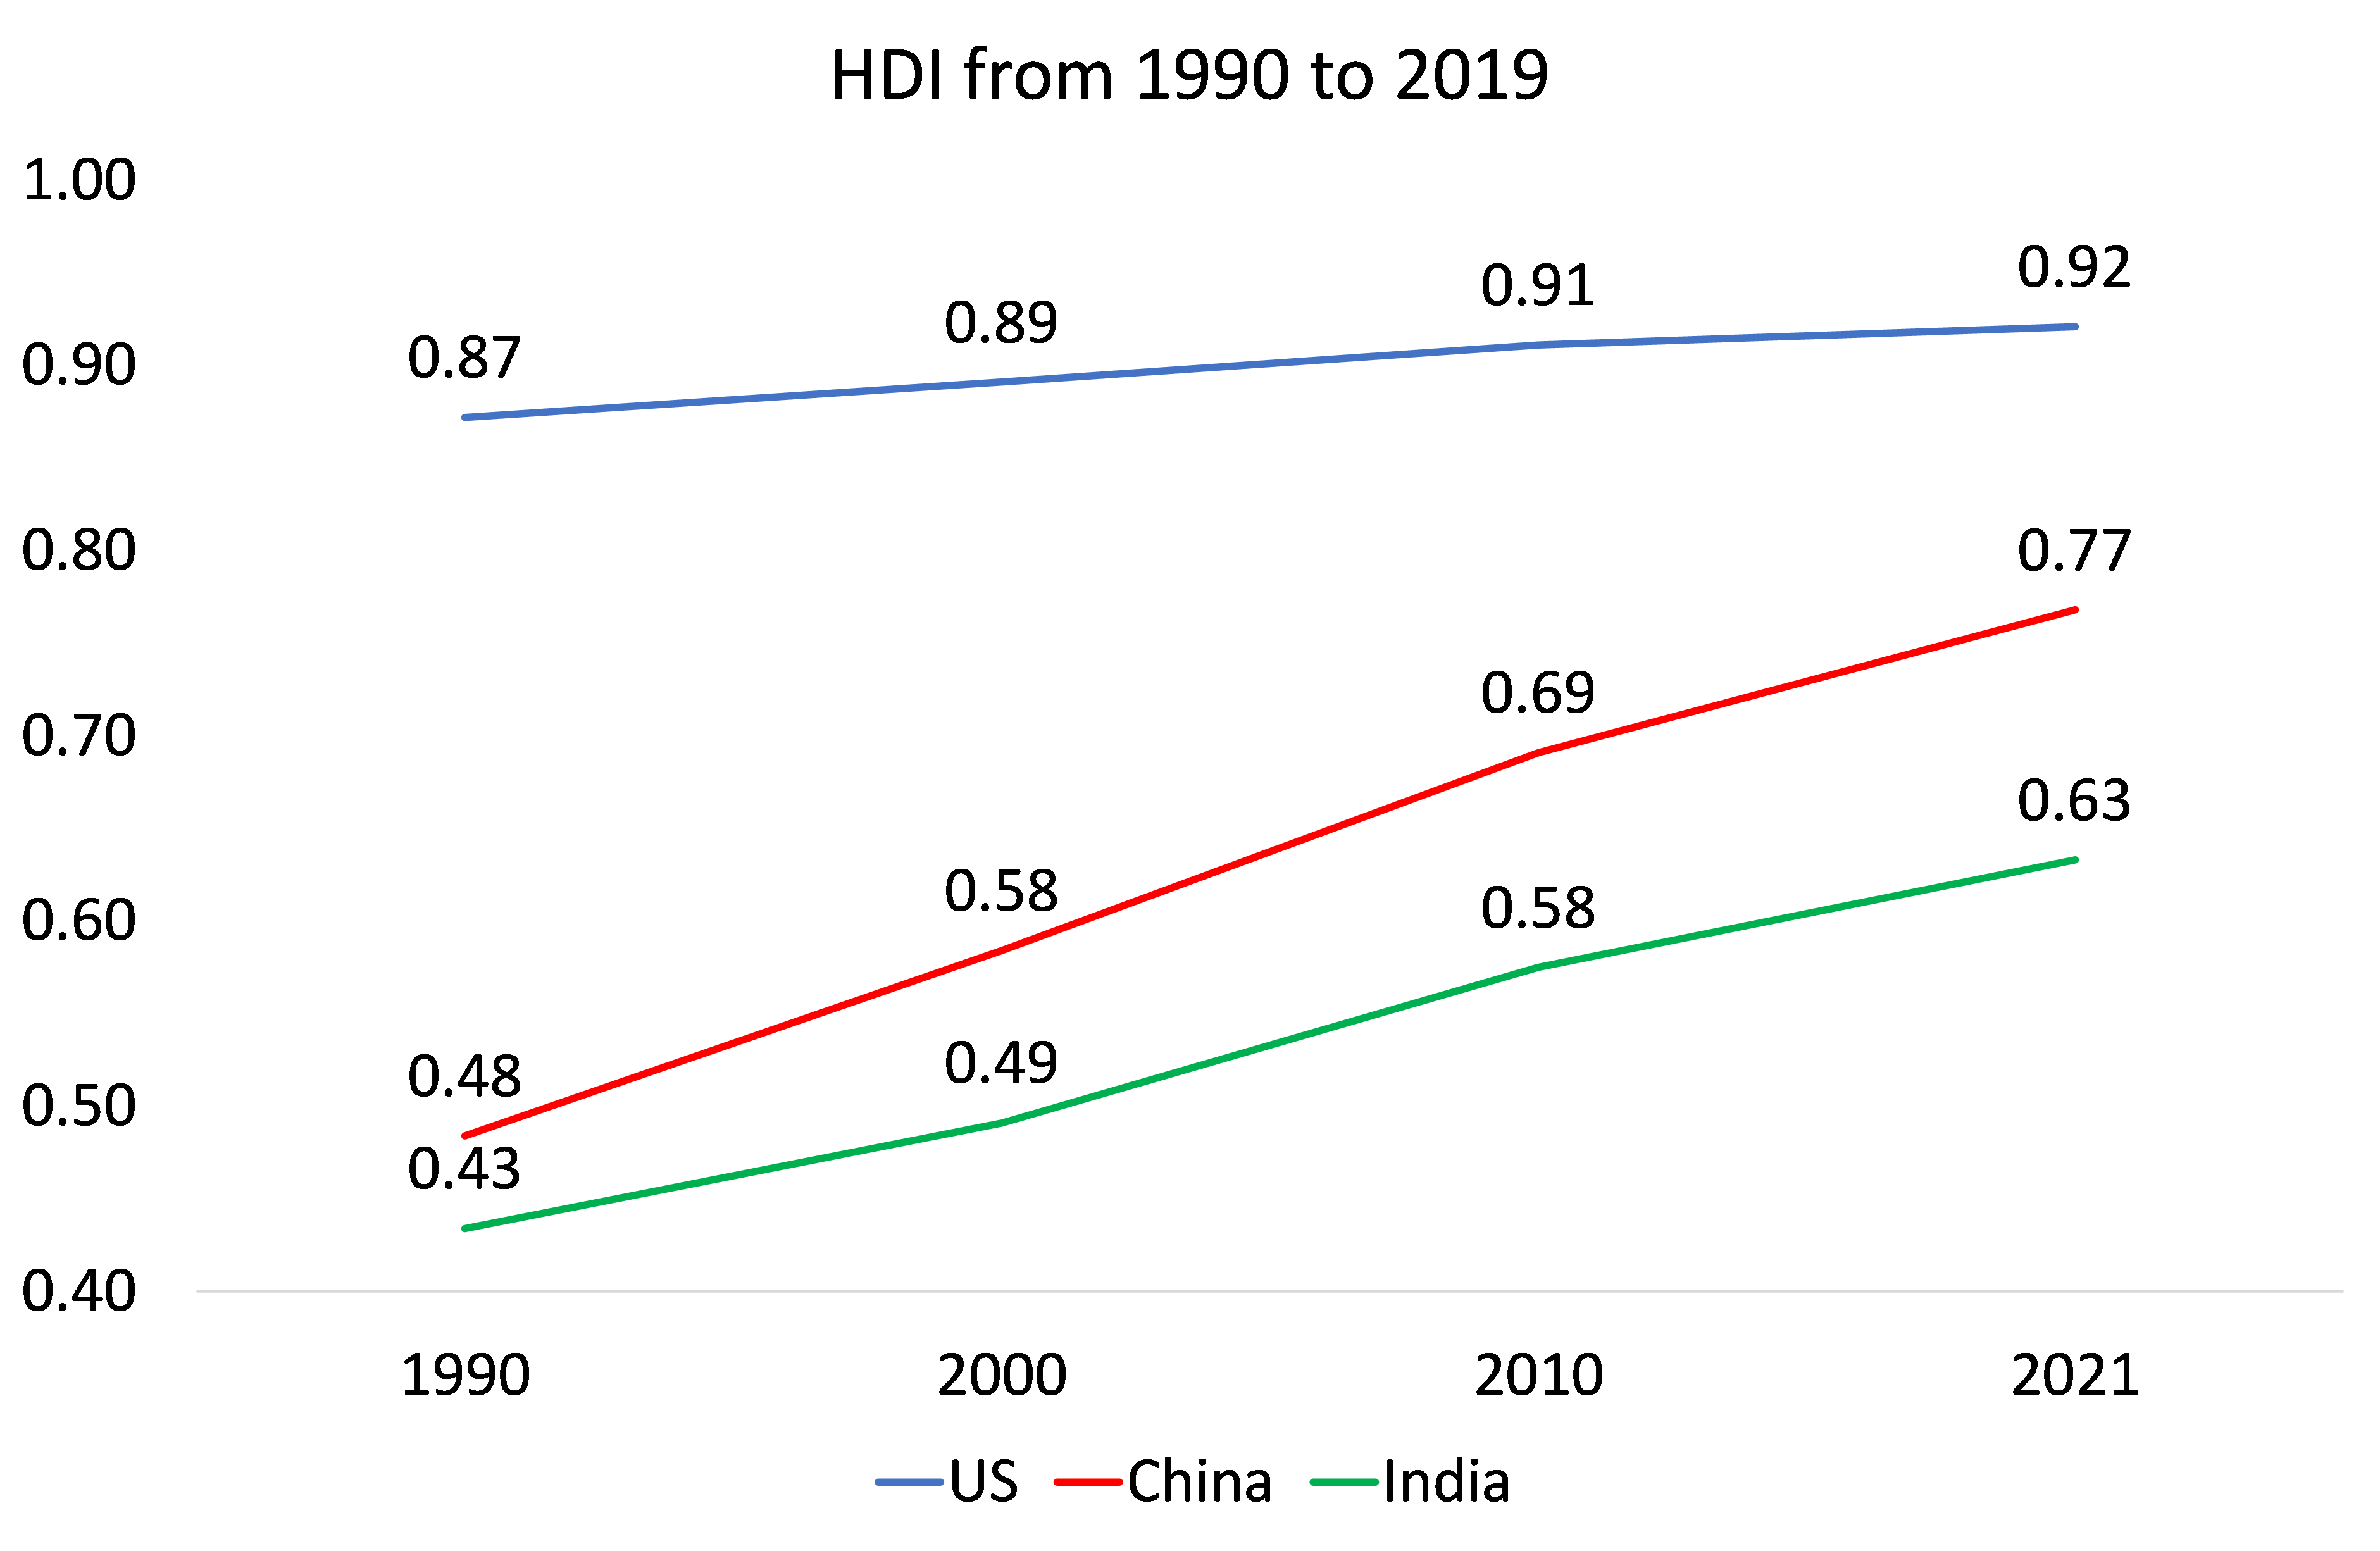
If we look at the largest so-called emerging economies by population, including the BRICS (Brazil, Russia, India, China and South Africa), as you might expect, China achieved the greatest improvement in its HDI of all countries. From a lowly 0.48 in 1990, China’s HDI reached 0.77 in 2021, a rise of 59%. Compare that to India, which started pretty much at the same HDI as China but reached only 0.63 in 2021, a rise of 46% but still way less than China.
| 1990 | 2000 | 2021 | 1990-2021 | 2000-21 | |
| Arg | 0.72 | 0.78 | 0.84 | 16.5 | 8.1 |
| Turk | 0.60 | 0.67 | 0.84 | 39.7 | 25.1 |
| Russ | 0.74 | 0.73 | 0.82 | 10.6 | 12.3 |
| Slan | 0.64 | 0.69 | 0.78 | 23.0 | 13.7 |
| Ukr | 0.73 | 0.70 | 0.77 | 6.0 | 10.4 |
| China | 0.48 | 0.58 | 0.77 | 58.7 | 31.5 |
| Mex | 0.66 | 0.71 | 0.76 | 14.5 | 6.9 |
| Bra | 0.61 | 0.68 | 0.75 | 23.6 | 11.0 |
| S Afr | 0.63 | 0.63 | 0.71 | 12.8 | 12.6 |
| Indo | 0.53 | 0.60 | 0.71 | 34.0 | 18.5 |
| India | 0.43 | 0.49 | 0.63 | 45.9 | 28.9 |
Whereas China was just 5pts higher in its HDI than India in 1990, now it is 14 pts higher. In those three decades, China has come from behind to overtake Mexico, Brazil, South Africa and Indonesia – and close the gap with the US from 40pts behind to just 15 pts.
For topical purposes, I also looked at Ukraine, Sri Lanka and Russia. In 1990, when the Soviet bloc fell, Ukraine had a HDI of 0.73, virtually the same as Russia and ahead of tiny debt-ridden Sri Lanka. By 2000, the ‘shock therapy’ of the return to capitalism lowered the HDI in Ukraine and Russia while all others in the list rose. And 30 years later, Ukraine’s HDI has crawled up just 6% to 0.77, falling behind Sri Lanka and Russia, both of which did not do very well either.
Are the major economies of the global South catching up with the G7 countries of the global North? If we exclude China and India, then the global South average (as defined above) was 18pts behind the G7 average in 1990. In 2021, the gap was 14pts. So hardly any progress in closing the gap in 30 years. And the countries of Global South chosen here are mostly the best performers, not the poorest and weakest.
Returning to the measure of life expectancy, we find that as people have healthier and longer lives, they become more skilled and educated and so enable economies to grow and to raise incomes and livelihoods. So public health measures are the most important lever for fostering economic development.
The news that after 140 years, scientists at the University of Oxford have finally developed a vaccine that has 80% effectiveness against the deadly disease of malaria, which has killed millions and still kills nearly one child a minute. The big pharma companies had avoided putting funds into malaria vaccines for decades, preferring to develop anti-depressants and cancer drugs that could sell well in the richer countries. So it has taken 140 years to develop the malaria vaccine compared to just one year to find a vaccine for COVID. The latter of course affected the Global North too. Now the possible eradication of malaria that affects primarily the Global South would probably be the most significant boost to life expectancy and human development this century.
Support us and become part of a media that takes responsibility for society
BRAVE NEW EUROPE is a not-for-profit educational platform for economics, politics, and climate change that brings authors at the cutting edge of progressive thought together with activists and others with articles like this. If you would like to support our work and want to see more writing free of state or corporate media bias and free of charge. To maintain the impetus and impartiality we need fresh funds every month. Three hundred donors, giving £5 or 5 euros a month would bring us close to £1,500 monthly, which is enough to keep us ticking over.

Be the first to comment