

Jo Michell is a Senior Lecturer in Economics at the University of the West of England, Bristol
Cross-posted from Critical Macro Finance
For some time now I’ve been arguing that not only does austerity have real effects but also financial implications.
When the government runs a deficit, it produces a flow supply of safe assets: government bonds. If the desired saving of the private sector exceeds the level of capital investment, it will absorb these assets without government spending inducing inflationary tendencies.
This was the situation in the aftermath of the 2008 crisis. Attempted deleveraging led to increased household saving, reduced spending and lower aggregate demand. Had the government not run a deficit of the size it did, the recession would have been more severe and prolonged.
When the coalition came to power in 2010 and austerity was introduced, the flow supply of safe assets began to contract. What happens if those who want to accumulate financial assets — wealthy households for the most part — are not willing to reduce their saving rate? If there is an unchanged flow demand for financial assets at the same time as the government reduces the supply, what is the result?
Broadly speaking there are two possible outcomes: one is lower demand and output: a recession. If growth is to be maintained, the only option is that some other group must issue a growing volume of financial liabilities, to offset the reduction in supply by the government.
In the UK, since 2010, this group has been households — mostly households on lower incomes. As the government cut spending, incomes fell and public services were rolled back. Unsurprisingly, many households fell back on borrowing to make ends meet.
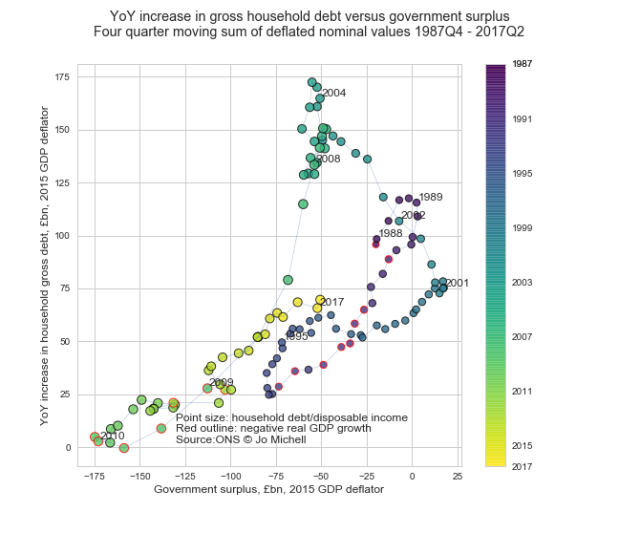
The graph below shows the relationship between the government deficit and the annual increase in gross household debt (both series are four quarter rolling sums deflated to 2015 prices).

From 2010 onwards, steady reduction in the government deficit was accompanied by a steady increase in the rate of accumulation of household debt. The ratio is surprisingly steady: every £2bn of deficit reduction has been accompanied by an additional £1bn per annum increase in the accumulation of household debt.
Note that this is the rate at which gross household debt is accumulated — not the “net financial balance” of the household sector. The latter is highlighted in discussions of “sectoral balances”, and in particular the accounting requirement that a reduction in the government deficit be accompanied by either an increase in the deficit of the private sector or a reduction in the deficit with the foreign sector.
Critics of the sectoral balances argument make the point that the net financial balance of the household sector is not the relevant indicator. Most household borrowing takes place within the household sector, mediated by the financial system. Savers hold bank deposits and pension fund claims, while other households borrow from the banks. The gross indebtedness of the household sector can therefore either increase or decrease without any change in the net position. Critics therefore see the sectoral balances arguement as incoherent because it displays a failure to understand basic national accounting. This view has been articulated by Chris Giles and Andrew Lilico, among others.
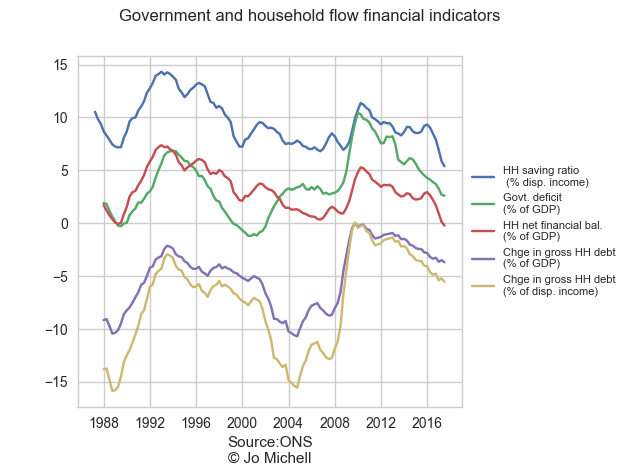
For the UK, at least, this criticism appears misplaced. The chart below plots four measures of the household sector financial position along with the government deficit. The indicators for the household sector are the net financial balance, gross household debt as a share of both GDP and household disposable income, and the household saving ratio. The correlation between the series is evident.
The relationship between the government deficit and the change in gross household debt is surprisingly stable. The figure below plots the series for the full period for which data are available from the ONS: from 1987 until 2017. With the exception of the period 2001-2008, where there is a clear structural break, the relationship is persistent.
Why should this be the case? One needs to be careful with apparently stable relationships between macroeconomic variables — they have a habit of breaking down. One reason for caution is that the composition of household debt has changed over the period shown: in the pre-2008 period most of the increase was mortgage borrowing, while post-crisis, consumer debt in the form of credit cards, car loans and so on has played an increasing role. Nonetheless, a hypothesis can be advanced:
If one group of households saves a relatively constant share of income — and this represents the majority of total saving in the household sector — then variance in the supply of assets issued by public sector must be matched either by variations in output and employment or by variance in the issuance of financial liabilities by other sectors. If monetary policy is used to maintain steady inflation and therefore relatively stable output and employment, changes in the cost of borrowing may induce other (non-saver) households to adjust their consumption decisions in such a way that stabilises output.
Put another way, if the contribution of government deficit spending to total demand varies and saving among some households is relatively inelastic, avoiding recessions requires another sector (or sub-sector) to go into deficit in order that total demand be maintained.
This hypothesis fits with the observation that the household saving ratio falls as the rate of gross debt accumulation increases. Paradoxically, the problem is not too little household saving but too much, given the volume of investment. If inelastic savers were willing to reduce their saving and increase consumption in response to lower government spending, then recession could be avoided without an increase in household debt. A better solution would be an increase in the business investment of the private sector: it is the difference between saving and investment that matters.
There is a clear structural break in the relationship between the deficit and household debt, starting around 2001. This is likely the result of the global credit boom which gathered pace after Alan Greenspan cut the target federal funds rate from 6.5% in 1999 to 1% in 2001. During this period, the financial position of the corporate sector shifted from deficit to surplus, matched by large rises in the accumulation of household debt. With the outbreak of crisis in 2008, the previous relationship appears to re-emerge.
Careful econometrics work is required to try and disentangle the drivers of rising household debt. But relationships between macroeconomic variables with this degree of stability are unusual. Something interesting is going on here.
EDIT: 22 November
Toby Nangle left a comment suggesting that it would be good to show the data on borrowing by different income levels. It’s a good point, and raises a complex issue about the distribution of lending and borrowing within the household sector. This is something that J. W. Mason and others have been discussing. I need another post to fully explain my thinking on this, but for now, I’ll include the following graph:

This is calculated using an experimental new dataset compiled by the ONS which uses micro data source to try and produce disaggregated macro datasets. Data are currently only available for three years — 2008, 2012, and 2013 — but I understand that the ONS are working on a more complete dataset.
What this shows is that in 2008, at the end of the 2000s credit boom, only the top two income quintiles were saving: the bottom 60% of the population was dissaving. In 2012 and 2013, the household saving ratio and financial balance had increased substantially and this shows up in the disaggregated figures as positive saving for all but the bottom quintile.
I suspect that as the saving ratio and net financial balance have subsequently declined, and gross debt has increased, the distributional pattern is reverting to what it looked like in 2008: saving at the top of the income distribution and dissaving in the lower quintiles.

Be the first to comment